バーンアップ チャート
The Burnup Chart provides a visual representation of a sprint's completed work compared with its total scope. It offers insights on your project's progress, as well as offers warnings to help you maintain your project's health; you can instantly identify problems such as scope creep or a deviation from the planned project path.
- ナビゲーション バーで [プロジェクト] をクリックし、関連するプロジェクトを選択します。
- [レポート] をクリックし、次に [バーンアップ チャート] を選択します。
- To choose a different sprint or a different measurement for the vertical axis, click the drop-down menus.
プロジェクト内のスプリントごとにバーンアップ チャートを表示できます。つまり、完了した作業量と残作業量を日次ベースで確認できます。
はじめる前に
- このバーンアップ チャートはスクラム ボードにのみ適用されます。
- サブタスクのストーリー ポイントは、バーンアップ チャートには含まれません (親タスクのストーリー ポイントのみが含まれます)。
バーンアップ チャートを理解する
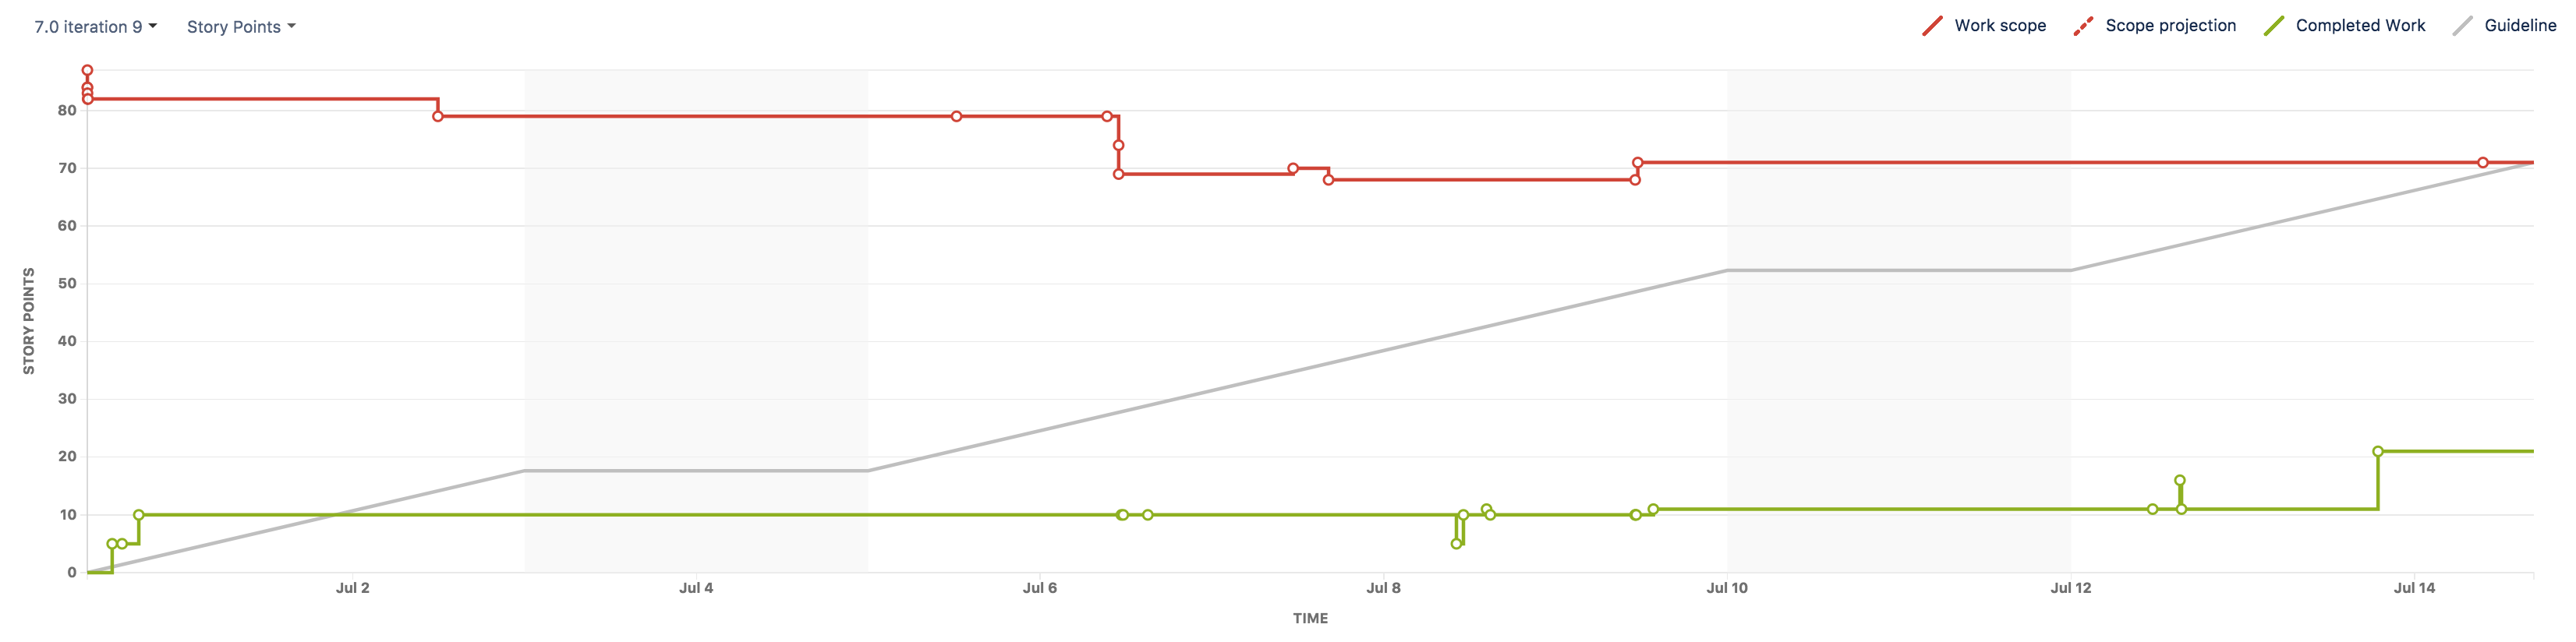
- The vertical axis represents the amount of work and can be measured in different ways such as story points, issue count, or estimates. The horizontal axis represents time in days.
- チャートの線と線の間の距離が作業残量です。プロジェクトが完了すると、線が交わります。
- スコープ クリープを特定するには、「作業スコープ」線を調べます。
最終更新日 2021 年 6 月 18 日
Powered by Confluence and Scroll Viewport.