Disabling or Enabling Analytics throws Configuration change could not be saved, check your connection with the server
プラットフォームについて: Server および Data Center のみ。この記事は、Server および Data Center プラットフォームのアトラシアン製品にのみ適用されます。
サーバー*製品のサポートは 2024 年 2 月 15 日に終了しました。サーバー製品を利用している場合は、アトラシアンのサーバー製品のサポート終了のお知らせページにて移行オプションをご確認ください。
*Fisheye および Crucible は除く
問題
When attempting to disable or enable the Analytics plugin on an Atlassian product results in the following error is thrown on the UI:
Configuration change could not be saved, check your connection with the server.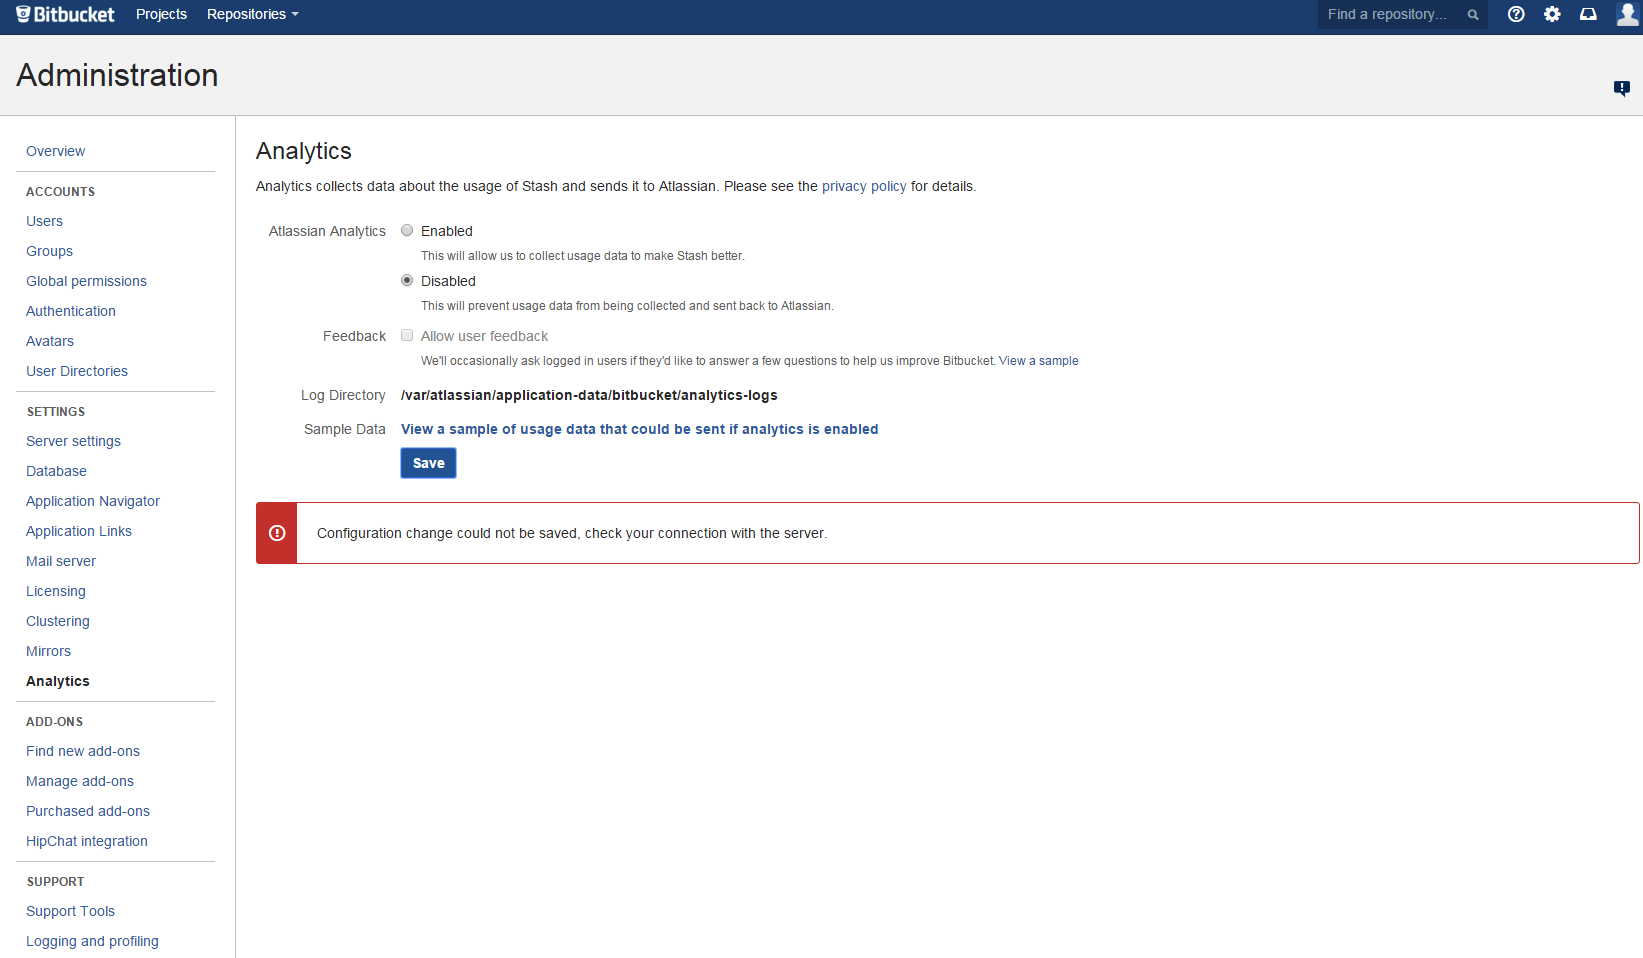
No error raised in the application logs.
診断
環境
- We were able to replicate this by installing AdBlock on a Chrome browser and configuring it by going to AdBlock options > Filter Lists > Other Filter Lists, and enabling "EasyPrivacy (privacy protection)".
Diagnostic Steps
- When you click "Enable" and then save on the screen above, there is a request being sent to a REST endpoint (i.e. on Bitbucket Server). The analysis below can be obtained from the "Network" tab of the "developer tool" of your browser. Refer to Generate a HAR file for more details on how to get there.
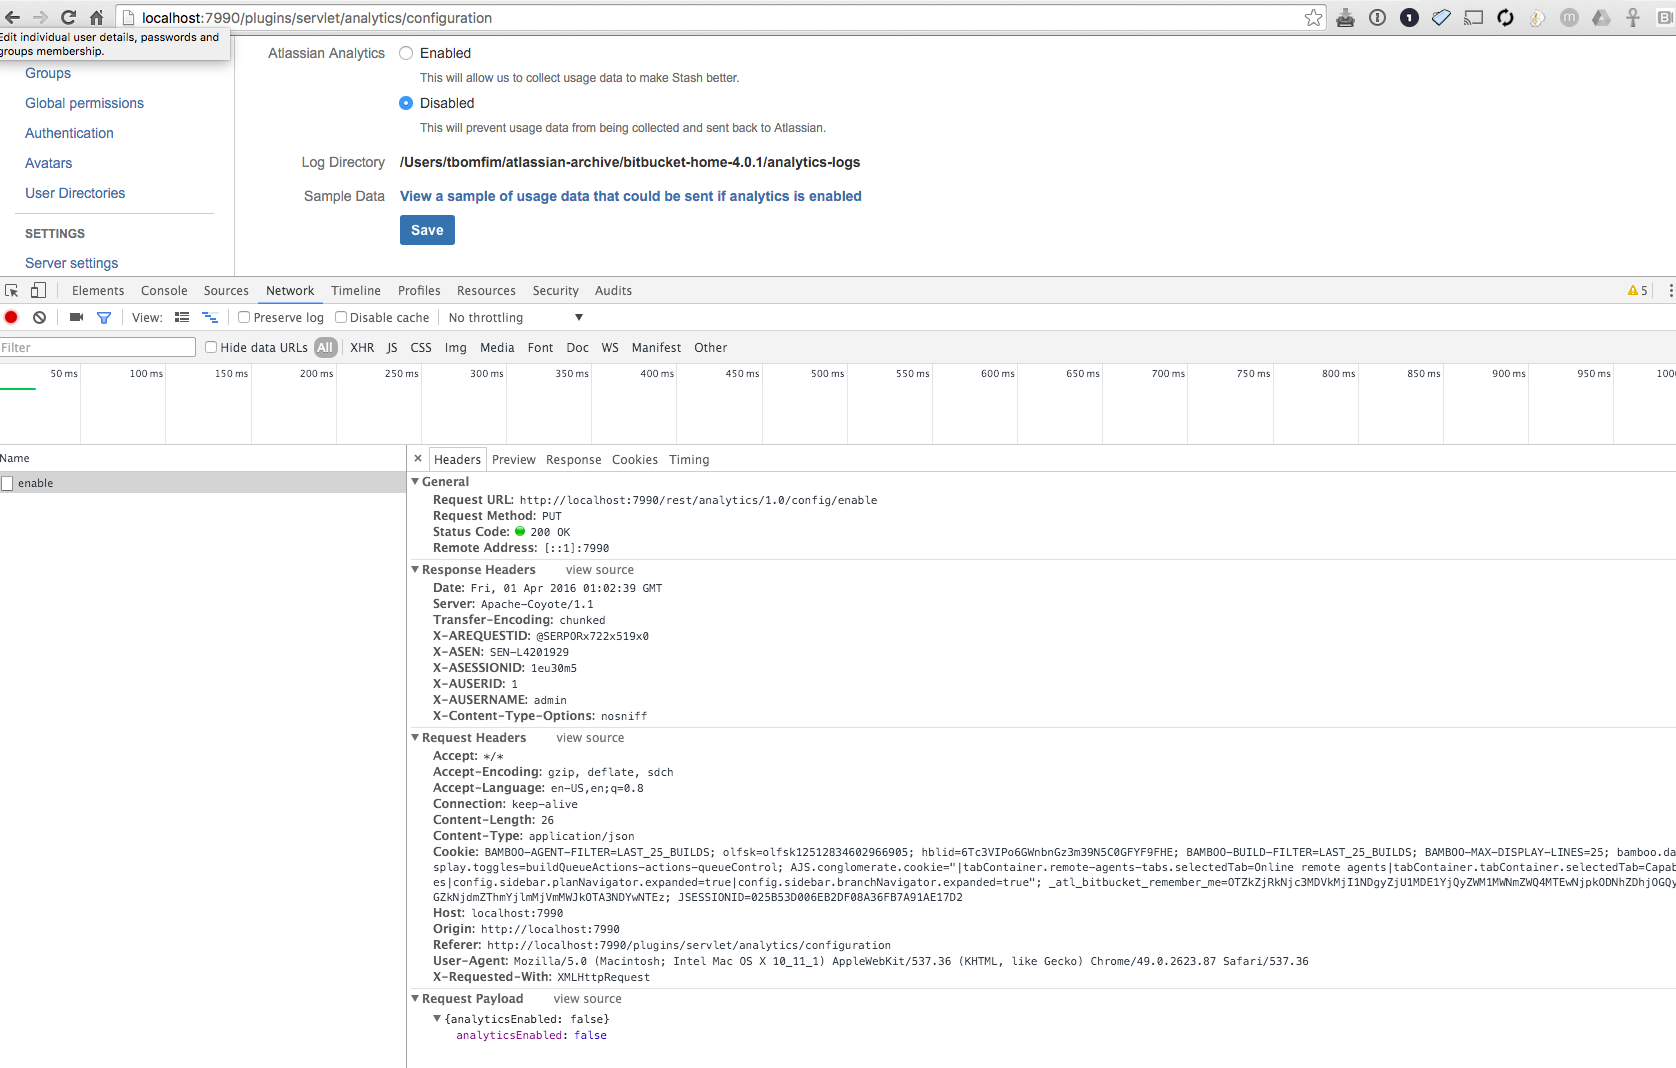
The error displayed above is caused by a JavaScript error. That's why there is nothing in the application server logs - the request doesn't make it to the server and the page errors that out.
From the Developer Tools of your browser, you can see that by doing these calls manually from a client machine you should be able Enable/Disable analytics by using, for example,
cURL:To Enable Analytics:curl -vvv -H "Content-Type:application/json" -H "Accept:application/json" --user admin:admin -X PUT -d '{"analyticsEnabled": "true"}' http://localhost:7990/rest/analytics/1.0/config/enableTo Disable Analytics:curl -vvv -H "Content-Type:application/json" -H "Accept:application/json" --user admin:admin -X PUT -d '{"analyticsEnabled": "false"}' http://localhost:7990/rest/analytics/1.0/config/enable- If you were able to successfully enable/disable Analytics by using
cURL, the problem is in your browser. - It is likely that if you open an "Incognito Window" on your browser you won't hit the issue as this measure bypasses any browser user-installed add-on.
原因
The error displayed above is caused by a JavaScript error. That's why there is nothing in the application server logs - the request doesn't make it to the server and the page errors that out. We were able to replicate this by installing AdBlock on a Chrome browser and configuring it by going to AdBlock options > Filter Lists > Other Filter Lists, and enabling "EasyPrivacy (privacy protection)".
ソリューション
Identify and fix the root cause by following the steps above. We've identified that the "AdBlock" (or uBlock, or any Ads blocker extensions) browser add-on may cause this issue.