JIRA チャート マクロ
Confluence サイトが JIRA アプリケーションに接続されている場合、 Confluence ページ上のグラフとして課題を表示できます。Confluence を、JIRA Software や JIRA Service Desk などの JIRA アプリケーションへ接続できます。
このマクロを使用するには、Confluence および JIRA アプリケーションがアプリケーション リンクを介して接続されている必要があります。ページを表示しているユーザーは、公開されている課題のグラフを見ることができます。JIRA アプリケーションに表示制限が設定されている場合 (したがって、ユーザーは課題を表示する権限が必要)、グラフを表示する前に認証が必要です。このマクロは、JIRA .5 x 以降と互換性があります。
このページの内容
JIRA チャート マクロをページに追加する
JIRA チャートをご使用のページに追加するには:
- エディターで、挿入 > その他のマクロ > JIRA グラフを選択します。
- 作成するレポートのタイプを選択します (円グラフ、作成済み vs 解決済み)
ご使用の JIRA サーバーを選択します。
複数の JIRA サーバーが Confluence にリンクされている場合、ドロップダウンにプライマリ アプリケーション リンクが既定として表示されます。- 課題の検索 - クエリを JQL に入力するか、JIRA URL を検索フィールドに直接貼り付けることができます。
- プレビュー を選択してグラフを表示します。
- 表示オプションを選択して、グラフの表示方法をさらに制御します。
- [挿入] をクリックします。
課題の検索に関する詳細は、「JIRA のクエリ言語 (JQL) を利用した課題の表示」を参照してください。
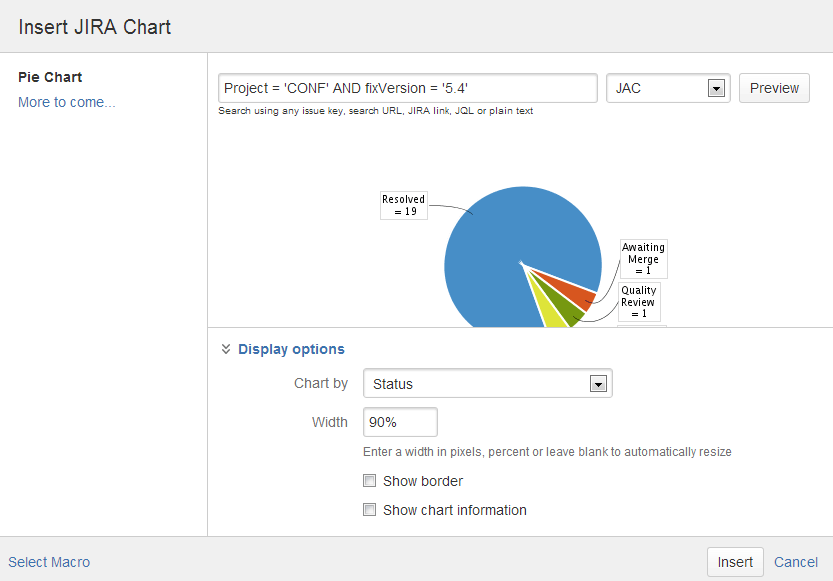
スクリーンショット:マクロ ブラウザー内の JIRA チャート マクロ
円グラフ
 円グラフは課題ステータス、優先度、担当者などのレポートに使用できます。
ページ上でのグラフの表示方法をさらに制御することも可能です。表示オプション を選択します。
- グラフの種類 - 円グラフを分割するフィールドを選択します。例:
- ステータス
- 修正バージョン
- 担当者名
- Priority
- コンポーネント
- 課題タイプ
- 幅 - チャート領域の全幅を定義します。値をピクセル、パーセントで入力するか、自動で適合させるには空白のままにすることができます。
- 境界線の表示 - チャート領域の周囲に境界線を追加します。
- グラフ情報を表示 - チャートの下に合計課題件数とグラフの種類の値と共にテキスト サマリを表示します。
作成済み vs 解決済みグラフ
 「作成済み vs 解決済み課題」レポートは、長期間にあたる作成済み課題の数と解決済み課題の数の差を示すために使用できます。
ページ上でのグラフの表示方法をさらに制御することも可能です。次の表示オプションから選択します。
- 期間 - レポートのタイムフレームを選択します (週、月、四半期など)。
- 過去の日数 - レポート対象の合計日数 (今日からカウントダウン)。
- 累積合計 - 各期間の合計値を徐々に加算するか、個別値を報告するかを選択します。
- 未解決のトレンドを表示する - 時間の経過とともに未解決の問題を示すサブプロットを追加します。
- バージョンの表示 - バージョンのリリース日をグラフ上の縦のラインで表します。
- 幅 - チャート領域の全幅を定義します。値をピクセル、パーセントで入力するか、自動で適合させるには空白のままにします。
- 境界線の表示 - チャート領域の周囲に境界線を追加します。
- グラフ情報を表示 - チャートの下に合計課題件数とグラフの種類の値と共にテキスト サマリを表示します。
2 次元グラフ
 二次元グラフは課題統計をマトリックスで示すために使用されます。これらのフィールドを表示するよう X 軸または Y 軸を設定できます。
- ステータス
- Priority
- 担当者
- 修正バージョン
- コンポーネント
- 課題タイプ。
たとえば、課題をステータス別にしたグラフを使用することができます (上記のように)。
グラフの軸を設定するには、「表示オプション:」を選択します。
- X 軸 - X 軸 (列) に表示する課題フィールド。
- Y 軸 - Y 軸 (行) に表示する課題フィールド。
- 表示行数 - グラフに表示する最大数。
JIRA チャート マクロの無効化
The functionality is provided by an add-on (plugin) called 'JIRA Macros'. This macro is also used for the JIRA Issues macro. To make the macro unavailable on your site, you can disable the add-on. See Disabling and enabling apps.
注意
HTTPS:Confluence サーバーが JIRA SSL 証明書を受け入れるように設定されている場合には、JIRA チャート マクロは SSL で実行中の JIRA サイトにアクセスできます。「SSL 経由で LDAP、 JIRA アプリケーション、または他のサービスに接続する」を参照してください。
認証:認証が必要な課題 (JIRA で匿名ユーザーに表示されない課題) を含むクエリの場合、Confluence ページ上のチャートを表示するために認証を求めるプロンプトが出されます。
マクロ ブラウザーで課題を検索するには認証が必要な場合があります。 JIRA 5.x では、匿名ユーザーとして、アクセス制限のない課題を検索することができますが、JIRA 6.x では、どのような課題でも検索するには認証が必要です。
コードの例
次の例は、Confluence ページの基本的なマークアップを調べたり、編集したりする上級ユーザー向けに提供されています。
マクロ名: jirachart
マクロ本文: なし。
The following parameters are available in storage format. Note that some parameters are only available for specific chart types.
パラメーター名 | Chart type | 必須 | 既定 | パラメーターの説明と指定可能な値 |
|---|---|---|---|---|
| すべて | はい | 円 | Type of chart to display. Chart types include:
|
showinfor | すべて | いいえ | False | データに関する情報をチャートの下にテキストで表示します。 合計値とグラフの種類の値も含まれます。 |
jql | すべて | はい | 表示するチャートの JQL クエリ | |
width | すべて | 600 | (空白) | これはチャート領域の全幅です。幅はピクセルまたはパーセントで入力できます。または、空白のままにして、利用可能なスペースに合わせることも可能です。 |
border | すべて | いいえ | False | チャート領域周囲の境界線を表示します。 |
statType | pie | はい | ステータス | 円グラフを分割する JIRA フィールド:
|
periodName | createdvsresolved | はい | Time frame to report by. Options are There is a limit to the number of days the report can generate for each period. For example you can report hourly for a maximum of ten days, and report daily for a maximum of 300 days. | |
daysprevious | createdvsresolved | はい | False | Number of days, counting backwards from today, to include in the report. Note that maximum days limits might apply depending on the Period you have chosen. |
isCumulative | createdvsresolved | いいえ | False | If true, the chart will progressively add data. If false the chart will show individual values for each period. |
showUnresolvedTrend | createdvsresolved | いいえ | False | Include a subplot showing unresolved issues trend. |
versionLabel | createdvsresolved | いいえ | なし | Indicate version release dates with a vertical line. Values include major, all and none. |
xstattype |
| はい | ステータス | JIRA field for the X axis (columns) of the chart. These are the same issue fields that are available in the |
ystattype | twodimensional | はい | 担当者 | JIRA field for the Y axis (rows) of the chart. These are the same issue fields that are available in the |
numberToShow | twodimensional | いいえ | 5 | Maximum number of rows to include in the chart. |
Storage format example - Pie Chart
Example chart by Issue Type - note that Confluence will insert the server and serverId parameters, based on settings in Application Links:
<ac:structured-macro ac:name="jirachart">
  <ac:parameter ac:name="chartType">pie</ac:parameter>
  <ac:parameter ac:name="statType">issuetype</ac:parameter>
  <ac:parameter ac:name="showinfor">true</ac:parameter>
  <ac:parameter ac:name="jql">project%20%3D%20CONF%20and%20fixVersion%20in%20('5.3')</ac:parameter>
  <ac:parameter ac:name="width">600</ac:parameter>
  <ac:parameter ac:name="server">JAC</ac:parameter>
  <ac:parameter ac:name="serverId">144880e9-a353-312f-9412-e5028e8166fa</ac:parameter>
  <ac:parameter ac:name="border">true</ac:parameter>
</ac:structured-macro>
Storage format example - Created vs Resolved
Example chart - note that Confluence will insert the server and serverId parameters, based on settings in Application Links:
<p><ac:structured-macro ac:name="jirachart">
  <ac:parameter ac:name="isAuthenticated">true</ac:parameter>
  <ac:parameter ac:name="versionLabel">all</ac:parameter>
  <ac:parameter ac:name="jql">project%20%3D%20confluence%20and%20component%20%3D%20documentation</ac:parameter>
  <ac:parameter ac:name="showUnresolvedTrend">true</ac:parameter>
  <ac:parameter ac:name="width">450</ac:parameter>
  <ac:parameter ac:name="daysprevious">30</ac:parameter>
  <ac:parameter ac:name="isCumulative">true</ac:parameter>
  <ac:parameter ac:name="chartType">createdvsresolved</ac:parameter>
  <ac:parameter ac:name="showinfor">false</ac:parameter>
  <ac:parameter ac:name="server">JAC</ac:parameter>
  <ac:parameter ac:name="serverId">144880e9-a353-312f-9412-e5028e8166fa</ac:parameter>
  <ac:parameter ac:name="border">true</ac:parameter>
  <ac:parameter ac:name="periodName">daily</ac:parameter>
</ac:structured-macro></p>
Storage format example - Two Dimensional Chart
Example chart - note that Confluence will insert the server and serverId parameters, based on settings in Application Links:
<ac:structured-macro ac:name="jirachart">
  <ac:parameter ac:name="chartType">twodimensional</ac:parameter>
  <ac:parameter ac:name="ystattype">issuetype</ac:parameter>
  <ac:parameter ac:name="sortBy" />
  <ac:parameter ac:name="isAuthenticated">true</ac:parameter>
  <ac:parameter ac:name="jql">project%20%3D%20CONF%20and%20Component%20%3D%20Documentation</ac:parameter>
  <ac:parameter ac:name="width" /><ac:parameter ac:name="server">JAC</ac:parameter>
  <ac:parameter ac:name="numberToShow">10</ac:parameter>
  <ac:parameter ac:name="sortDirection" />
  <ac:parameter ac:name="serverId">144880e9-a353-312f-9412-ed528e8166fa</ac:parameter>
  <ac:parameter ac:name="xstattype">statuses</ac:parameter>
</ac:structured-macro>