Jira Service Management 5.4.x 長期サポート リリースのパフォーマンス レポート
このページでは、Jira Service Management 4.20 と Jira Service Management 5.4 長期サポート リリースのパフォーマンスを比較しています。

長期サポート リリースについて
Jira Service Management を定期的にアップグレードすることをお勧めします。ただし、組織のプロセスによって年に 1 回程度しかアップグレードできない場合は、長期サポート リリースへのアップグレードが良い選択肢となります。これにより、該当するバージョンのサポート終了まで、重大なセキュリティ、安定性、データ整合性、パフォーマンスの問題に継続的に対応できるようになります。
パフォーマンス
アトラシアンは、他のすべての長期サポート リリースと同様に、これまでと同等かそれ以上のパフォーマンスを実現することを目標にしています。Jira Service Management 5.4 のテストでは、ワークロード レポートの表示およびアセットのインポートとスケーリングのパフォーマンスが大幅に向上したことがわかりました。また、カスタマー ページの表示、サービス課題の表示、カスタマー リクエストの作成においても、顕著な改善が見られました。
リクエストの表示、キューの表示、およびアセット オブジェクトの作成で、パフォーマンスがいくらか低下しました。これらは、Jira Service Management 4.20 LTS 以降に製品で行われた機能の改善に起因する可能性があります。
このセクションでは、Server と Data Center の両方について、Jira Service Management 4.20 を Jira Service Management 5.4 と比較します。両方のバージョンについて、4 つのカテゴリに分けられる広範なテスト シナリオを実行しました。
軽量な操作
中程度の操作
重い操作 (実行に時間がかかる)
Insight の操作 (アセット管理機能に関連)
パフォーマンスは、5000 ユーザーのインスタンスでピーク トラフィックと推定されるユーザー負荷下で計測されました。操作やテスト方法の詳細については、「テスト手法」をご確認ください。
軽量な操作
グラフは、個々の操作の応答時間の違いを示しています。グラフの作成に使用されたデータは下部で確認できます。
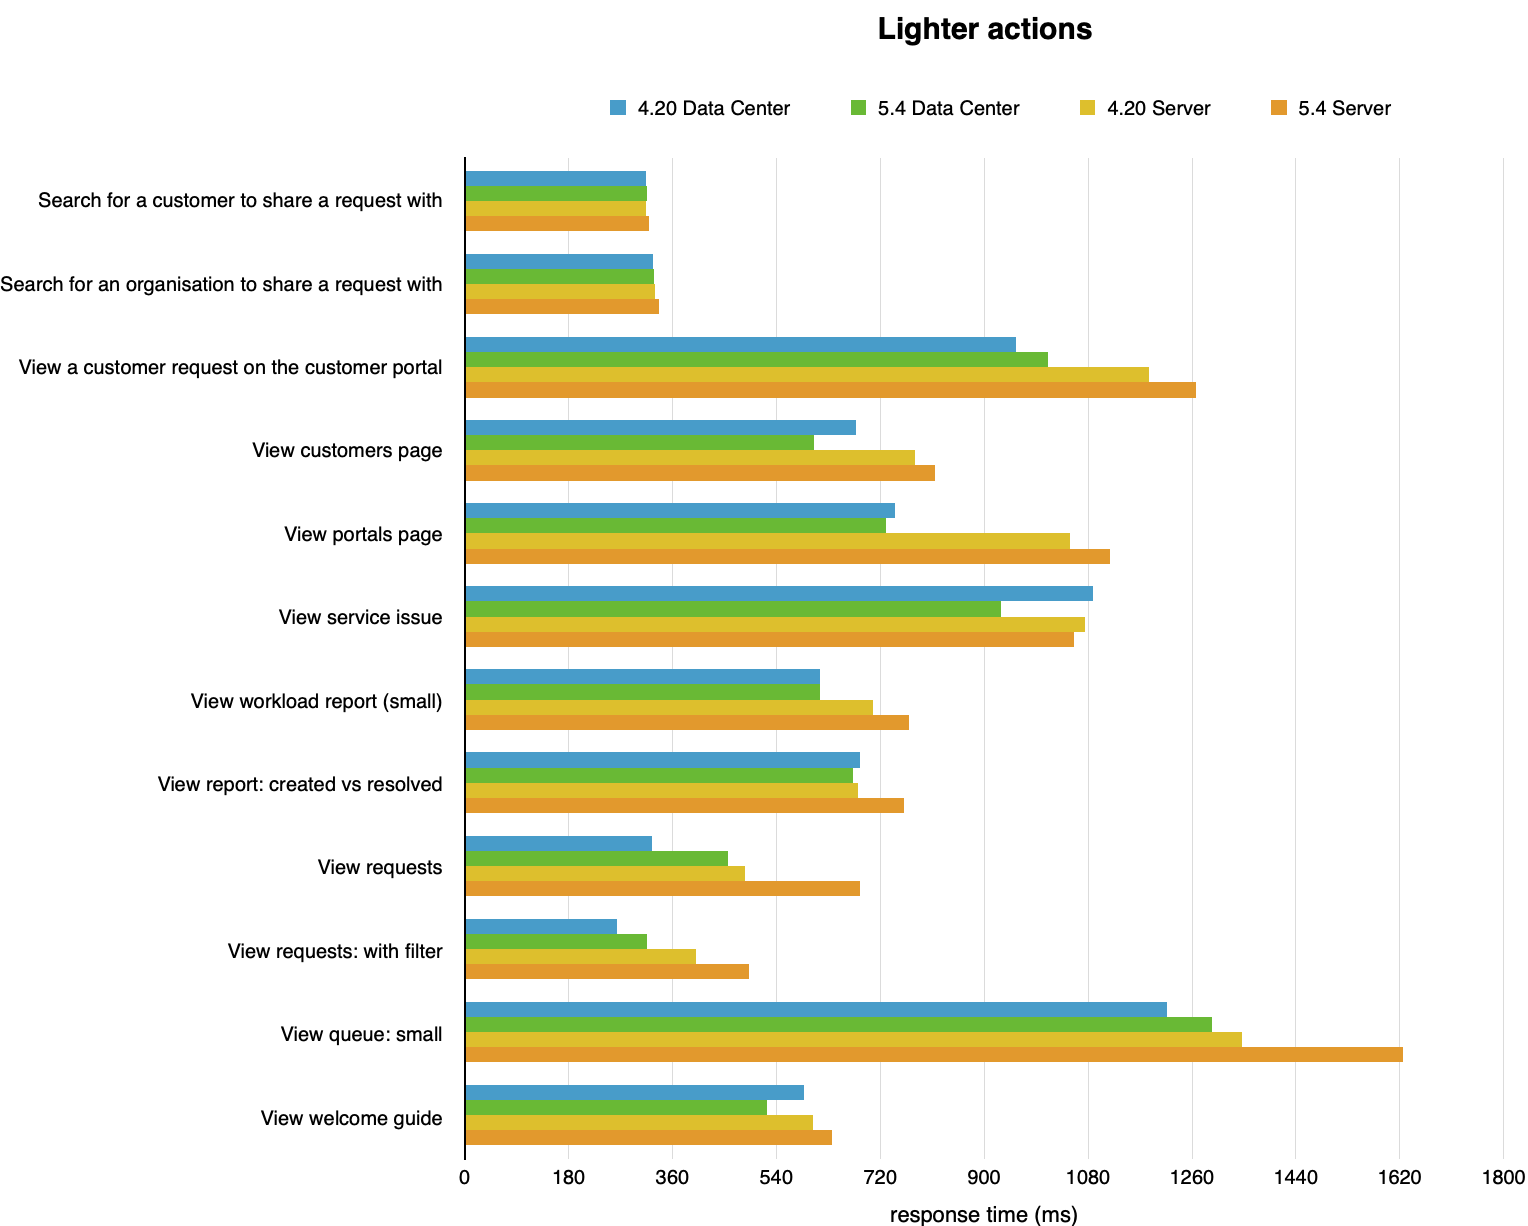
次の表は、軽量な操作の平均レスポンス時間を表します。
操作 | 平均レスポンス時間 (ミリ秒、短いほうが望ましい) | |||
4.20 Server | 5.4 Server | 4.20 Data Center | 5.4 Data Center | |
|---|---|---|---|---|
リクエストを共有するカスタマーを検索 | 313 | 319 | 314 | 316 |
リクエストを共有する組織を検索 | 329 | 337 | 326 | 327 |
カスタマー ポータルでカスタマー リクエストを表示 | 1185 | 1266 | 954 | 1,010 |
カスタマー ページの表示 | 779 | 814 | 678 | 605 |
ポータル ページの表示 | 1048 | 1117 | 745 | 730 |
サービス課題の表示 | 1074 | 1056 | 1088 | 929 |
ワークロード レポート (小) の表示 | 707 | 769 | 616 | 616 |
レポートの表示: 作成済 vs 解決済 | 681 | 761 | 684 | 673 |
リクエストの表示 | 486 | 685 | 325 | 455 |
リクエストの表示: フィルターを使用 | 400 | 493 | 264 | 315 |
キューの表示: 小 | 1346 | 1625 | 1216 | 1294 |
ウェルカム ガイドの表示 | 603 | 636 | 588 | 524 |
中程度の操作
グラフは、個々の操作の応答時間の違いを示しています。グラフの作成に使用されたデータは下部で確認できます。
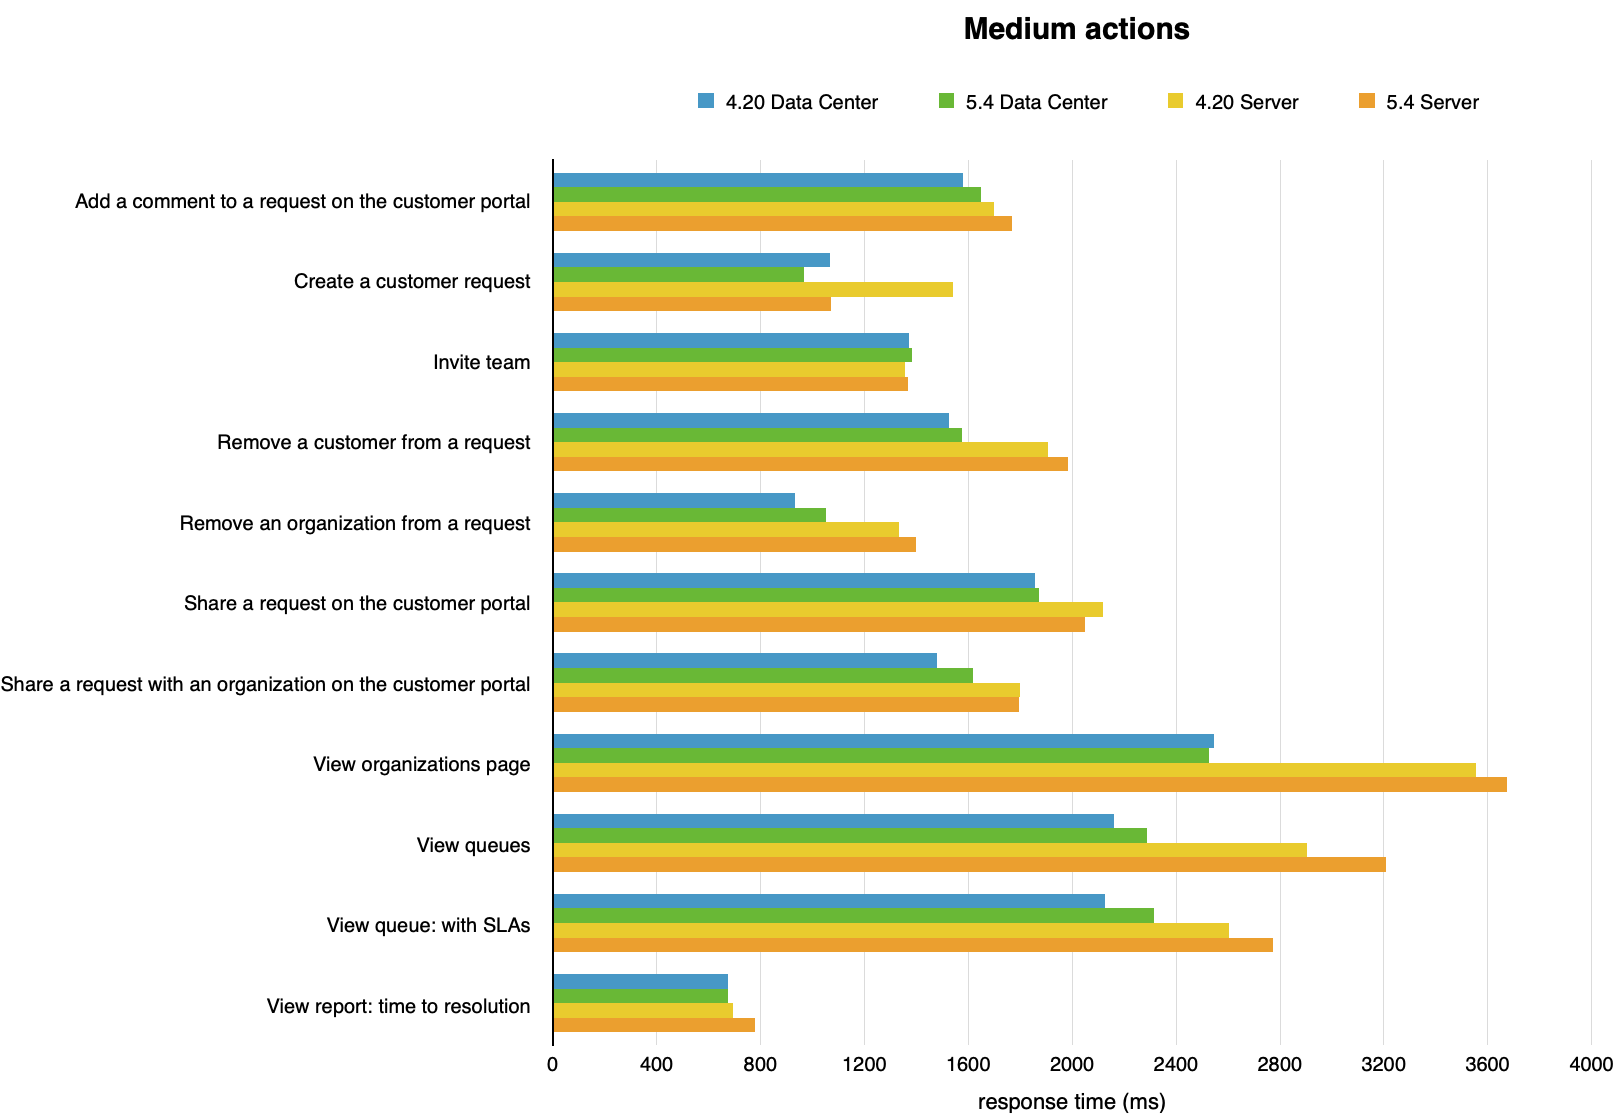
次の表は、中程度の操作の平均レスポンス時間を表します。
操作 | 平均レスポンス時間 (ミリ秒、短いほうが望ましい) | |||
4.20 Server | 5.4 Server | 4.20 Data Center | 5.4 Data Center | |
|---|---|---|---|---|
カスタマー ポータルでリクエストにコメントを追加 | 1697 | 1767 | 1580 | 1649 |
カスタマーリクエストを作成 | 1539 | 1069 | 1068 | 968 |
チームの招待 | 1356 | 1366 | 1373 | 1383 |
リクエストからカスタマーを削除 | 1906 | 1984 | 1527 | 1577 |
リクエストから組織を削除 | 1334 | 1398 | 933 | 1052 |
カスタマー ポータルでカスタマーとリクエストを共有 | 2118 | 2047 | 1855 | 1870 |
カスタマー ポータルで組織とリクエストを共有 | 1798 | 1796 | 1478 | 1616 |
組織ページの表示 | 3554 | 3672 | 2547 | 2526 |
キューを表示 | 2904 | 3207 | 2161 | 2288 |
キューの表示: SLA があるキュー | 2604 | 2772 | 2126 | 2315 |
レポートの表示: 解決までの時間 | 694 | 780 | 675 | 673 |
重い操作
グラフは、個々の操作の応答時間の違いを示しています。グラフの作成に使用されたデータは下部で確認できます。
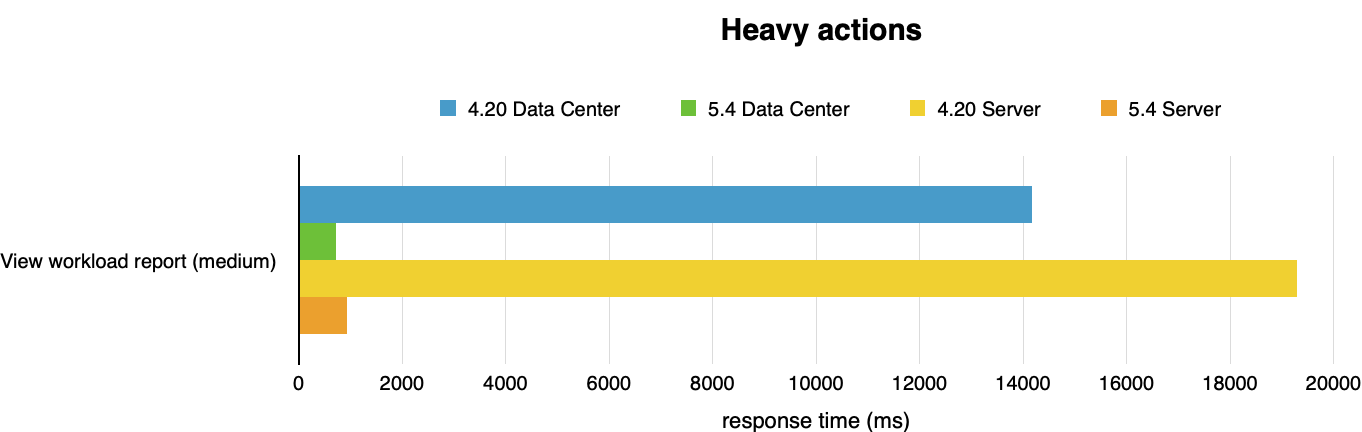
次の表は、重い操作の平均レスポンス時間を表します。
操作 | 平均レスポンス時間 (ミリ秒、短いほうが望ましい) | |||
4.20 Server | 5.4 Server | 4.20 Data Center | 5.4 Data Center | |
|---|---|---|---|---|
ワークロード レポート (中) の表示 | 19288 | 935 | 14164 | 728 |
アセット操作
グラフは、個々の操作の応答時間の違いを示しています。グラフの作成に使用されたデータは下部で確認できます。
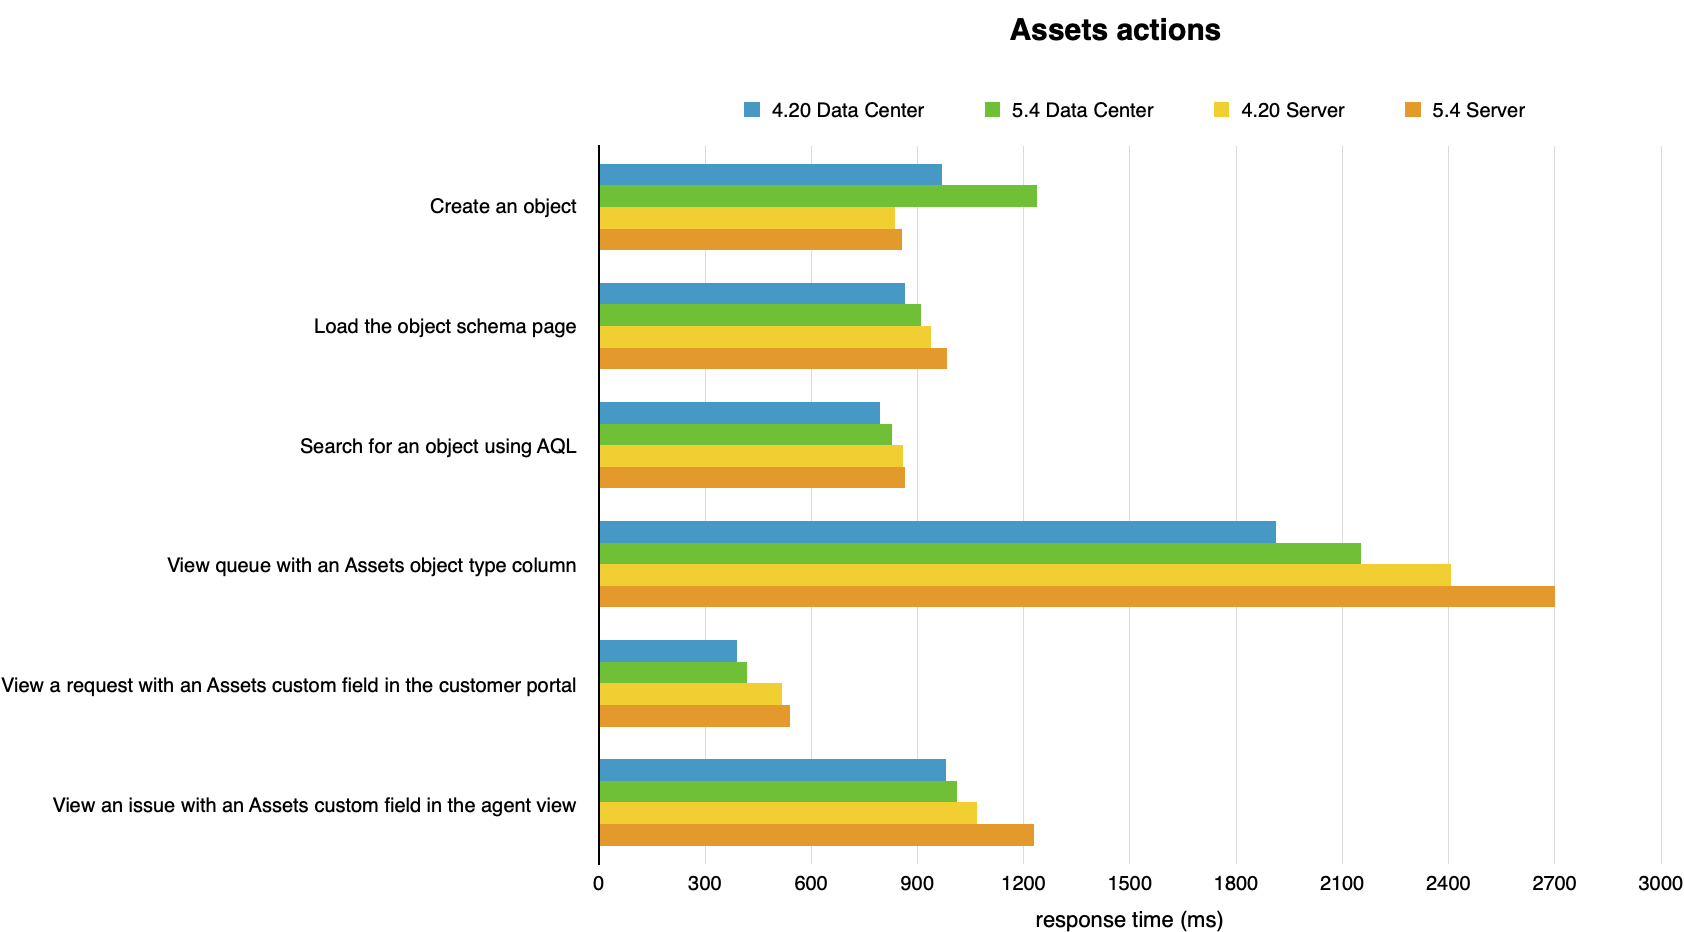
次の表は、アセット操作の平均応答時間を表します。
操作 | 平均レスポンス時間 (ミリ秒、短いほうが望ましい) | |||
4.20 Server | 5.4 Server | 4.20 Data Center | 5.4 Data Center | |
|---|---|---|---|---|
アセット オブジェクトを作成 | 837 | 855 | 970 | 1237 |
オブジェクト スキーマ ページの読み込み | 939 | 982 | 864 | 910 |
IQL を使用したオブジェクトの検索 | 860 | 866 | 795 | 827 |
アセット オブジェクト タイプ列を含むキューを表示 | 2408 | 2700 | 1912 | 2152 |
カスタマー ポータルでアセット カスタム フィールドを含むリクエストを表示 | 516 | 539 | 390 | 417 |
エージェント ビューでアセット カスタム フィールドを含む課題を表示 | 1068 | 1230 | 981 | 1012 |
アセットのインポート速度とスケーリング
製品でのユーザー操作のパフォーマンスに加えて、アセットでのメモリの使用方法、インポートの実行方法、および一括操作の処理方法も改善されています。
インポート オブジェクトの作成が 55-70% 速くなりました。
大規模なデータセットに対して必要になるメモリが 20-35% 減りました。
アセットのインデックス再作成が 10 倍速くなりました。
複雑なオブジェクト タイプ階層のクエリとインポートが最大で 25 倍速くなりました*。
アセットのユーザー インターフェイスによるオブジェクトの一括削除が 4.8 倍速くなりました。
インポートをメモリではなくディスクにオフロードするということは、アセットが以前よりもはるかに大きなインポートに対応できるようになったことを意味します。
* National Vulnerability Database (NVD) のインポート速度で実証されています。
概要
パフォーマンスは高負荷下においても製品全体でおおむね安定しており、いくつかの改善が見られました。主に注目すべき点を次に示します。
ワークロード レポート (中) の表示が 19.4 倍速くなりました。
カスタマー ページの表示が 1.1 倍速くなりました。
サービス課題の表示が 1.2 倍速くなりました。
カスタマー リクエストの作成が 1.1 倍速くなりました。
インポート オブジェクトの作成が 55-70% 速くなりました。
大規模なデータセットに対して必要になるメモリが 20-35% 減りました。
リクエストの表示、キューの表示、およびアセット オブジェクトの作成で、パフォーマンスがいくらか低下しました。これらは、新しいリクエスト リスト機能 (4.21 および 5.3)、SLA の計算精度を向上させるために加えられた変更 (5.0)、およびアセットのアクセシビリティとユーザー インターフェイスのさまざまな改善 (5.0、5.1、5.2、5.3) に起因する可能性があります。
アトラシアンでは、サービス チームがワークスペース内を簡単に移動でき、最大規模のお客様が自信を持って拡張できるよう、パフォーマンスのさらなる改善に向けて今後も取り組んでいく予定です。
テスト手法
以下のセクションでは、当社のパフォーマンス テストで使用するテスト環境 (ハードウェア仕様を含む) とテスト方法を詳しく説明します。
テスト方法
テストを開始する前に、一般に大規模な Jira Service Management インスタンスを表すデータセットのサイズと内容を決定する必要がありました。これを実現するために、アナリティクス データを使用して、お客様の環境の全体像を把握したり、大規模な組織で Jira Service Management を拡張する際にお客様が直面する問題を特定したりしました。
また、Jira Service Management Data Center の一部となったアセットのデータ セットも用意しました。
次の表では、各データ ディメンションを 99 パーセンタイルの値で切り捨てています。これらの値を使用して、ランダムなテスト データを含むサンプル データセットを生成しました。
基準となるデータ セット
データ | 値 |
|---|---|
管理 | 1 |
コメント | 609570 |
コンポーネント | 7195 |
カスタム フィールド | 42 |
グループ | 3 |
課題タイプ | 13 |
課題 | 302109 |
エージェント | 1000 |
優先度 | 5 |
プロジェクト | 1001 |
解決状況 | 8 |
画面スキーム | 2395 |
画面 | 14934 |
ステータス | 23 |
ユーザー | 101003 |
バージョン | 3 |
ワークフロー | 3717 |
アセットのデータ セット
データ | 値 |
|---|---|
オブジェクト スキーマ | 6 |
オブジェクト タイプ | 341 |
オブジェクト | 315837 |
属性 | 2488972 |
実行した操作
最も一般的なユーザー操作の例を表す混合操作を選択しました。このコンテキストにおける操作とは、ブラウザ ウィンドウで課題を開くなどの、完全なユーザー操作です。次の表は、ペルソナのテスト用にスクリプトに含めた操作の詳細と、1 回のテスト中に各操作が何回繰り返されるかを示しています。
軽量、中程度、および重い操作
操作 | 説明 | 1 回のテストで操作を実行した回数 |
|---|---|---|
カスタマー ポータルでリクエストにコメントを追加 | ポータルでランダムなカスタマー リクエストを開き、エージェントとしてランダムなコメントを追加します。 | ~240 |
カスタマーリクエストを作成 | カスタマー ポータルを開き、課題の要約と説明を入力し、リクエストを送信します。 | ~140 |
チームの招待 | 左側のメニューの [チームの招待] を選択し、1,000 エージェントのインスタンスでエージェントを検索して [招待] ボタンをクリックし、成功の確認を待ちます。 | ~150 |
リクエストからカスタマーを削除 | ポータルでランダムなカスタマー リクエストを開き、[共有先] 列でランダムなカスタマーを削除します。 | ~140 |
リクエストから組織を削除 | ポータルでランダムなカスタマー リクエストを開き、[共有先] 列でランダムな組織を削除します。 | ~140 |
リクエストを共有する組織を検索 | ポータルでランダムなカスタマー リクエストを開き、リクエストを共有するランダムな組織を検索します。 | ~140 |
リクエストを共有するカスタマーを検索 | ポータルでランダムなカスタマー リクエストを開き、リクエストを共有するランダムなカスタマーを検索します。 | ~140 |
カスタマー ポータルで組織とリクエストを共有 | ポータルでランダムなカスタマー リクエストを開き、リクエストをランダムな組織と共有します。 | ~140 |
カスタマー ポータルでカスタマーとリクエストを共有 | ポータルでランダムなカスタマー リクエストを開き、リクエストをランダムなカスタマーと共有します。 | ~140 |
ワークロード レポート (小) の表示 | オープンな課題がないプロジェクトのワークロード レポートを表示します。 | ~210 |
ワークロード レポート (中) の表示 | 1,000 件の割り当て済みの課題と 700 人のエージェントを持つプロジェクトのワークロード レポートを表示します。 | ~220 |
キューの表示: すべてのオープンな課題 | 10,000 件を超えるオープンな課題を持つプロジェクトでデフォルトのサービス キューを表示します。 | ~720 |
キューの表示: 小 | 10,000 件を超えるオープンな課題を持つプロジェクトで、ほとんどの課題をフィルタリングするカスタムのサービス キューを表示します。 | ~820 |
キューの表示: SLA があるキュー | 10,000 件を超えるオープンな課題を持ち、各課題に 6 件の SLA 値があるプロジェクトで、カスタム サービス キューを表示します。 | ~700 |
カスタマー ページの表示 | 100,000 人のカスタマーを持つプロジェクトで [顧客] ページを表示します。 | ~340 |
組織ページの表示 | 50 社の組織と 300 人のカスタマーを持つプロジェクトで [顧客] ページを表示します。 | ~340 |
ポータル ページの表示 | 一意のヘルプ センター リンクを選択することで、すべてのカスタマー ポータルを含むヘルプ センターを表示します。 | ~810 |
レポートの表示: 作成済 vs 解決済 | タイムラインに 10,000 件を超える課題がある、作成済 vs 解決済レポートを表示します。 | ~210 |
レポートの表示: 解決までの時間 | タイムラインに 10,000 件を超える課題がある、解決までの時間レポートを表示します。 | ~220 |
リクエストの表示 | カスタマー ポータルで [マイ リクエスト] 画面を表示します。 | ~840 |
リクエストの表示: フィルターを使用 | カスタマー ポータルで、要約の 1 つの単語でフィルタリングした状態の [マイ リクエスト] 画面を表示します。 | ~840 |
サービス課題の表示 | エージェント ビューで 6 つの SLA 値を持つサービス課題を表示します。 | ~830 |
カスタマー ポータルでカスタマー リクエストを表示 | カスタマー ポータルでランダムな課題を表示します。 | ~520 |
ウェルカム ガイドの表示 | 左側のメニューから [ウェルカム ガイド] を表示します。 | ~210 |
アセット操作
操作 | 説明 | 1 回のテストで操作を実行した回数 |
|---|---|---|
オブジェクトを作成 | 既存のオブジェクト スキーマでアセット オブジェクトを作成します。 | ~170 |
オブジェクト スキーマ ページの読み込み | 既存のオブジェクト スキーマを開きます。 | ~530 |
アセット オブジェクト タイプ列を含むキューを表示 | 結果にアセット オブジェクトの列を含むカスタム キューを表示します。約 1000 件の課題が返されることが想定されます。 | ~420 |
IQL を使用したオブジェクトの検索 | 既存のオブジェクト スキーマで IQL を使用してオブジェクトを検索します。 | ~200 |
カスタマー ポータルでアセット カスタム フィールドを含むリクエストを表示 | アセット カスタム フィールドを 1 つ含むカスタマー リクエストを開きます。 | ~450 |
エージェント ビューでアセット カスタム フィールドを含む課題を表示 | アセット カスタム フィールドを 1 つ含む課題を開きます。 | ~210 |
ユーザー操作のテスト環境
すべてのパフォーマンス テストは、一連の AWS EC2 インスタンス上で実行されました。テストごとに環境全体をリセットおよび再構築し、各テストの最初にはインスタンス キャッシュをウォームアップするためのアイドル サイクルを実行しました。以下で、Jira Service Management Server および Data Center で使用された環境の詳細や、EC2 インスタンスの仕様を確認できます。
テストを実行するため、スクリプトを組んだブラウザーを 21 個使用し、操作の実行にかかる時間を計測しました。各ブラウザーのスクリプトは、定義済みの操作リストからランダムに操作を実行し、すぐに次の操作に移る (つまり思考時間ゼロ) ように組まれています。これによって各ブラウザーは実際のユーザーが可能なタスクよりも実質的に多くのタスクを実行するため、ブラウザーの数が実際の同時実行ユーザー数と等しくなると解釈することはできません。
各テストは 40 分間実行され、その後、統計情報が収集されます。
ここでは、テスト環境の詳細について説明します。
| Jira Service Management Server | Jira Service Management Data Center |
|---|---|
環境の構成内容:
| 環境の構成内容:
|
| Server 用の Jira Service Management | |||
|---|---|---|---|
| ハードウェア | ソフトウェア | ||
| EC2 タイプ: | Server 用に 1 ノード | Operating system | Ubuntu 16.04LTS |
| CPU: | Intel Xeon E5-2666 v3 (Haswell) | Java プラットフォーム | Java 1.8.0 |
| CPU コア: | 36 | Java オプション | 16 GB ヒープ |
| メモリ | 60 GB | ||
| ディスク: | AWS EBS 100 GB gp2 | ||
| DC 用の Jira Service Management | |||
|---|---|---|---|
| ハードウェア | ソフトウェア | ||
| EC2 タイプ: | Server 用に 1 ノード | Operating system | Ubuntu 16.04LTS |
| CPU: | Intel Xeon Platinum 8000 シリーズ (Skylake-SP) | Java プラットフォーム | Java 1.8.0 |
| CPU コア: | 16 | Java オプション | 16 GB ヒープ |
| メモリ | 32 GB | ||
| ディスク: | AWS EBS 100 GB gp2 | ||
| データベース | |||
|---|---|---|---|
| ハードウェア | ソフトウェア | ||
| EC2 タイプ: | m4.2xlarge (「EC2 タイプ」を参照) | データベース: | MySQL 5.5 |
| CPU: | Intel Xeon E5-2666 v3 (Haswell) | オペレーティング システム: | Ubuntu 16.04LTS |
| CPU コア: | 8 | ||
| メモリ | 32 GB | ||
| ディスク: | Jira Service Management Server: Jira Service Management Data Center: | ||
| ロード ジェネレーター | |||
|---|---|---|---|
| ハードウェア | ソフトウェア | ||
| EC2 タイプ: | c4.8xlarge (「EC2 タイプ」を参照) | オペレーティング システム: | Ubuntu 16.04LTS |
| CPU: | Intel Xeon E5-2666 v3 (Haswell) | ブラウザ: | ヘッドレス Chrome |
| CPU コア: | 36 | 自動化スクリプト: |
|
| メモリ | 60 GB | ||
| ディスク: | AWS EBS 30 GB gp2 | ||