Advanced Roadmaps プランを表示
この図では、特定のタイプのアクションに特化した各機能がグループ化されています。

1. ビューを管理する
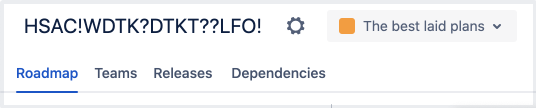
プランの左上隅にあるタブでは、プランのどの側面を表示しているかを切り替えることができます。次の 4 つのタブがあります。
- ロードマップ ビューは、プロジェクトの計画を立てる場所です。この画面では、予定期間を表すスケジュール バーと併せてプランに含まれる課題がレイアウトされています。プランの作成に関する詳細については「Advanced Roadmaps のプラン」ページをご参照ください。
- チーム には、計画に含まれるチームの詳細情報が表示されます。計画を構築すると、これらのチームまたは個人に作業を割り当てられます。Advanced Roadmaps のチームに関する詳細についてご確認ください。
- リリースでは、計画に関連付けられたリリースを構成して管理します。計画のリリースを使用する方法についてご確認ください。
依存関係レポートには、リンクされていて特定の順序で完了する必要がある課題の視覚的なマップが表示されます。詳細については、依存関係レポートをご確認ください。
計画名の横にある ![]() から計画の設定メニューを表示して、計画固有の設定を行えます。計画の設定を変更する方法についてご確認ください。
から計画の設定メニューを表示して、計画固有の設定を行えます。計画の設定を変更する方法についてご確認ください。
右側のメニューは [シナリオ] メニューです。プランでシナリオが有効になっている場合は、これを使用してプランの異なるバージョン間を移動します。有効になっていない場合は、このメニューは表示されません。Advanced Roadmaps で Advanced Roadmaps のシナリオに関する詳細についてご確認ください。
2. ビューを変更する

Advanced Roadmaps のこの領域では、ルールを適用してタイムラインに表示される情報を制限します。
Advanced Roadmaps では、右上に 4 つの事前設定済みのビューが用意されており、いつでも呼び出せる独自のカスタム ビューも作成できます。[ビュー] メニューを使用して、これらのビューと保存済みのカスタム ビューを切り替えます。これらのビューに関する詳細については「Advanced Roadmaps の事前構成済みタイムライン ビュー」ページと「ビューを変更する」ページをご確認ください。
タブと [ビュー] メニューの下にあるレベルを使用して、プランの課題をフィルタリングして非表示にできます。[ロードマップ] タブの左下で、[階層] メニューでプランに表示する階層レベルを選択するか、[フィルター] メニューを使用して他の条件でフィルタリングします。タイムラインで課題をフィルタリングする方法の詳細についてご確認ください。
ヘッダーの右側でビュー設定を調整できます。時間枠のドロップダウン メニューを使用して、ロードマップでカバーする時間の長さを選択できます。3 か月 (3M)、1 年 (1Y)、またはスケジュールされたすべての作業がビューに収まるように時間枠を調整する [適合] から選択します。Advanced Roadmaps には独自の時間枠を設定するオプションもあります。[カスタム] を選択する際は、[固定] 日付を設定して特定の範囲を表示するか、[相対] を選択して現在の日付を基準とした連続期間 (たとえば、過去 2 週間、今後 3 か月など) を表示できます。
[設定を表示] メニューでは、タイムラインで課題と関連情報を表示する方法をカスタマイズできます。このメニューでは次を行えます。
3. プラン内の課題

[スコープ] セクションでは、Advanced Roadmaps が以下を表示します (左から右へ)。
- 課題ランキング (該当する場合)
- issuetype
- 課題キー
- 課題の概要
課題に子が含まれている場合は、矢印 (>) を選択して折りたたんだ行を展開します。または、[課題] ドロップダウン メニューを使用して、すべての課題の展開/折りたたみを行います。
[+課題の作成] ボタンを使用して課題を作成すると、Advanced Roadmaps は新しい課題を現在のプロジェクトの下部に配置します。子レベルの課題 (ストーリーやサブタスクなど) を作成した場合は、親タスクにリンクされるまではタイムラインの下部にある折りたたみ式の「親のない課題 x 件」に表示されます。
4. 列の課題値
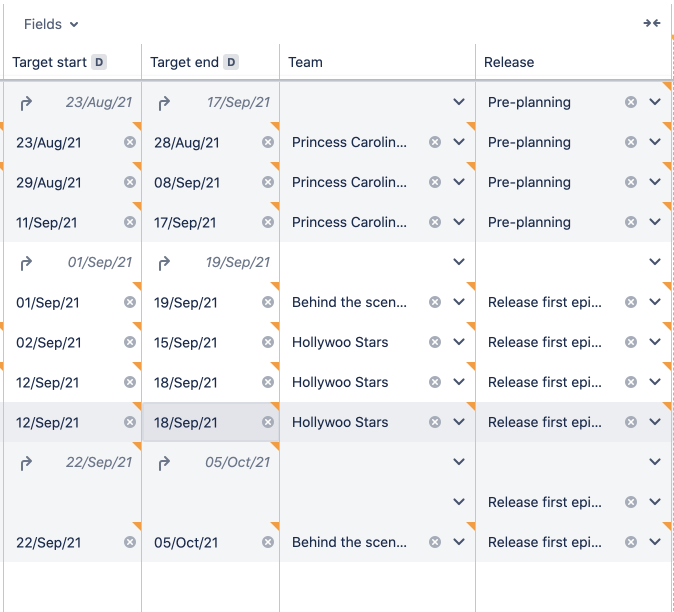
初期設定では、新規作成されたプランには [ターゲット開始]、[ターゲット終了]、[ステータス] の各列が含まれます。[フィールド] ドロップダウン メニューで、プラン機能ですでに構成されている値の列を追加できます。Advanced Roadmaps で列を追加、編集、削除する方法についてご確認ください。
これらのフィールドの値を変更するには、変更する値を選択して変更したら Enter キーを押すだけです。Advanced Roadmaps は、Jira 課題にコミットされていない変更があるフィールドの隅にオレンジ色のアクセント (上の画像で表示) を追加します。シナリオ内でプランを作成している場合、このアクセント マークは事前に選択した色になります。
5. タイムラインのスケジュール バー、依存関係、リリース

フィールド列の右側には、スケジュールされた課題の予想期間を表すタイムライン バーがあります。
また、課題バー自体には計画の構造の手がかりもあります。縞のバーは上記のように課題にロールアップ値があることを、課題の両端に表示されるリンク アイコンは課題に依存関係が追加されていることを示します。依存関係の詳細についてご確認ください。
また、Advanced Roadmaps では、スプリントのキャパシティ (図なし、詳細については「タイムラインからキャパシティを監視する」ページを参照) やプランに含まれるリリースを含むヘルス インジケーターが、プランのタイムラインに表示されます。これはタイムラインの上に赤と緑の円で表示されます。リリースの詳細については「リリースを監視する」セクションをご確認ください。
6. 計画をクリーン アップして変更を保存する

プランを実行に移す準備ができたら、[変更を確認] ボタンを使用してプランの値を Jira に戻して保存します。その過程で、既存の値が上書きされます。これによって、タイムラインで作成した課題、チーム、リリースが Jira プロジェクトで作成されます。これを行うまでは、Advanced Roadmaps で加えたすべての変更はプランにのみ反映されます。Jira 課題に変更を反映する方法について詳しくは、こちらをご確認ください。
シナリオ内でプランを作成している場合、Advanced Roadmaps は現在表示しているシナリオの値を保存します。
Advanced Roadmaps の警告では、プランに違反する課題を警告します。たとえば、日付がずれている依存関係がある場合などです。Advanced Roadmaps で Advanced Roadmaps の警告に関する詳細についてご確認ください。
プランを一般 (または同僚) に共有する準備ができたら、[共有方法] ボタンを使用してページを埋め込んだり、共有可能なリンクを作成したり、.csv ファイルとしてエクスポートしたりできます。Advanced Roadmaps データを共有する方法の詳細については「プランを共有してデータをエクスポート」ページをご確認ください。
Advanced Roadmaps には、課題の詳細と設定に基づいてプランを自動作成する自動スケジュール機能も用意されています。Advanced Roadmaps の自動スケジュール機能に関する詳細については「Advanced Roadmaps で課題を自動スケジュールする」ページをご確認ください。
Advanced Roadmaps が Jira Software Data Center の一部になりました。このページの機能にアクセスするには、Jira Software Data Center 8.15 またはそれ以降にアップグレードしてください。まだアップグレードできませんか? 現在の Data Center のバージョンに応じて、最新バージョンのアプリを (無償で) インストールすることでこれらの機能にアクセスできます。FAQ で詳細情報をご確認ください。