JMX インターフェイスを使用したライブ モニタリング
JMX (Java Management Extensions API) を使用すると、リアルタイムで Confluence インスタンスのステータスを監視できます。JMX は、MBeans (Managed Beans) と呼ばれるオブジェクトを使用して、アプリからデータやリソースを表示し、インスタンスのデータベース使用量やデータベース レイテンシなどの有益なデータを提供します。これにより、問題やパフォーマンスの課題を診断することができます。
このページでは、JConsole を使用して、Confluence をローカルおよびリモートで監視する方法について説明します。JConsole は Java Development Kit (JDK) に含まれていますが、どの JMX クライアントでも使用することができます。
このページには、JMX から利用できる製品内診断に関する情報も含まれています。
このガイドでは、JMX インターフェイスの基本的な概要を紹介します。内容は現状のまま提供されるものとします。アトラシアンのサポート チームは、Confluence で発生する特定の問題のトラブルシューティングをサポートできますが、監視システムのセットアップや、結果の解釈についてはサポート対象外です。
JMX によって Confluence を監視する
APM によって Confluence をリモート監視する
アプリケーション パフォーマンス監視 (APM) ツールで Confluence を監視するには、JMX エクスポーターをインストールして JMX MBeans をご利用のツールに適した形式に変換する必要があります。その方法については「アプリのパフォーマンスを監視する」をご参照ください。
アプリケーション パフォーマンス監視 (APM) システムをお持ちでないユーザー向けに、Prometheus と Grafana を開始するためのガイドを作成しました。このガイドには、出発点にできるテンプレート ダッシュボードも含まれています。「Prometheus と Grafana で Confluence を監視する」をご参照ください。
JConsole を使用してた Confluence のリモート監視
リモート監視は、Confluence サーバーのリソースを消費しないため、本番環境システムにお勧めです。
リモートで監視するには:
以下のプロパティを
setenv.sh/setenv.batファイルに追加します。ポートは未使用の任意のポートに設定できます。set CATALINA_OPTS=-Dcom.sun.management.jmxremote %CATALINA_OPTS% set CATALINA_OPTS=-Dcom.sun.management.jmxremote.port=8099 %CATALINA_OPTS%リモート接続の保護方法を決定します。詳細は、リモート監視と管理 を参照してください。
認証を無効化することは可能ですが、本番環境システムではお勧めしません。- JConsole を起動します (JDK インストール ディレクトリの
binディレクトリにあります)。 - リモート プロセス を選択します。
- ホスト名とポートを (Confluence ポートではなく、以前に指定したポート) を入力します。
- 接続 をクリックします。
リモート監視の詳細については、JConsole の使用を参照してください。
JConsole を使用して Confluence をローカルで監視する
特定の課題のトラブルシューティングや、Confluence を短期間のみ監視する必要がある場合は、ローカル監視を使用できます。ローカル監視はサーバーのパフォーマンスに影響を与える可能性があるため、本番システムの長期的な監視にはお勧めしません。
ローカルに監視するには:
JConsole を起動します (JDK インストール ディレクトリの
binディレクトリにあります)。- ローカル プロセス を選択します。
Confluence プロセスを選択します。
org.apache.catalina.startup.Bootstrap startのようになります。
ローカル監視の詳細については、JConsole の使用を参照してください。
JMX メトリックをログ ファイルに書き込む
次の JMX メトリクスをログ ファイルに書き込むことも選択できます。これは、問題をトラブルシューティングする際に便利です。
- キャッシュ統計
- IndexingStatistics
- MailTaskQueue
- RequestMetrics
- システム情報
- スレッド プール
- OS
- GC
- Threading
- TomcatManager
- RequestProcessor
JMX メトリクスをログ ファイルに書き込むには、次の手順に従います。
- [管理] メニュー
 から、[一般設定] > [予定されたジョブ] に移動します。
 - JMX メトリックをログ ジョブを有効にします。
このジョブは初期設定で 1 分に 1 回実行され、メトリックを <local-home/logs/atlassian-confluence-jmx.log ファイルに書き込みます。「Confluence ログを使用する」をご覧ください。
JMX 監視を無効にする
JMX 監視を無効にするには、次の手順に従います。
- [管理] メニュー から、[一般設定] > [モニタリング] に移動します。
- [JMX 監視] を選択解除します。
これによって、JMX を有効にする必要があるためアプリ監視も無効になります。
Confluence MBeans
以下の Confluence MBeans を使用して、Confluence インスタンスに関するライブ情報を確認できます。
キャッシュ統計
この MBean は、Confluence バージョンや稼働時間などの情報を示します。この情報は、キャッシュ統計ページにも表示されます。
IndexingStatistics
この MBean は検索インデックス作成に関連する情報を表示します。便利な属性をいくつか示します。
プロパティ名 | 機能 | 値 |
|---|---|---|
Flushing | キャッシュが現在フラッシュ中かどうかを示す | True/False |
LastElapsedMilliseconds | 最後のインデックス作成の所要時間 | ミリ秒 |
TaskQueueLength | キューにあるタスクの数を表示 | 整数 |
| ReIndexing | Confluence が現在再インデックス中かどうかを示す | True/False |
システム情報
この MBean は、Confluence バージョンや稼働時間などの情報を示します。この情報は、システム情報ページにも表示されます。
プロパティ名 | 機能 | 値 |
|---|---|---|
DatabaseExampleLatency | データベース対して実行されたクエリ例の待ち時間を表示。 | ミリ秒 |
RequestMetrics
この MBean はシステム負荷と表示されたエラーページに関連する情報を表示します。
プロパティ名 | 機能 | 値 |
|---|---|---|
AverageExecutionTimeForLastTenRequests | 最新 10 件の要求の平均実行時間。 | ミリ秒 |
CurrentNumberOfRequestsBeingServed | この時点で提供されている要求の数。 | 整数 |
ErrorCount | Confluence エラーページが提供された回数。 | 整数 |
NumberOfRequestsInLastTenSeconds | 最近 10 秒間の要求数。 | 整数 |
MailServer-SMTPServer
この MBean は、メールディスパッチの試行と失敗に関連する情報を表示します。Confluence インスタンスで設定された SMTP メールサーバーごとに MBean があります。
プロパティ名 | 機能 | 値 |
|---|---|---|
EmailsAttempted | Confluence が送信しようとしたメールメッセージの数。 | 整数 |
EmailsSent | 正常に送信されたメールメッセージの数。 | 整数 |
MailTaskQueue
この MBean は、メールワークロードに関連する情報を示します。
プロパティ名 | 機能 | 値 |
|---|---|---|
ErrorQueueSize | キュー内のエラー数。 | 整数 |
Flushing | 状態 (フラッシュの有無) を表示。 | True/False |
FlushStarted | 稼働を開始した時間。 | 時間 |
RetryCount | 実行された再試行の回数。 | 整数 |
TaskSize | ディスパッチのためにキューに入れられたメールメッセージの数。 | 整数 |
SchedulingStatistics
この MBean は現在のジョブ、スケジュール済みタスク、およびそれらが最後に実行された時間に関連する情報を表示します。
| プロパティ名 | 機能 | 値 |
|---|---|---|
| AllJobNames | 現在のジョブ、スケジュール済みタスク、およびそれらが最後に実行された時間に関連する情報を表示する | 文字列 |
| CurrentlyRunningJobNames | 現在実行中のスケジュール済みジョブを一覧表示する | 一覧 |
アプリ固有の指標
アプリ監視を有効にして、Marketplace やカスタムビルド アプリに関する問題のトラブルシューティングに役立つ追加の指標を表示します。
アプリ固有の指標に関する全リストは「アプリ指標の参照」をご参照ください。
追加の MBeans
Hibernate および Hazelcast を監視する (Confluence Data Center のみ) には、まず、setenv.sh / setenv.bat ファイルに次のプロパティを追加する必要があります。
set CATALINA_OPTS=-Dconfluence.hazelcast.jmx.enable=true %CATALINA_OPTS%
set CATALINA_OPTS=-Dconfluence.hibernate.jmx.enable=true %CATALINA_OPTS%
これにより、お使いの JMX クライアントでハイバーネイトおよび Hazelcast MBeans を使用できるようになります。
CPU 消費量が多いスレッドを監視する
JConsole の上位スレッド プラグインは、CPU のスパイクが発生しているかどうかを監視するのに便利です。以下のコマンドを使用して、このコマンドで JConsole を起動します。
JConsole -pluginpath /pathto/topthreads.jarJMX から利用できる製品内診断
データベース接続、HTTP 接続、インデックス作成に関する製品内診断用メトリックを組み合わせて JMX から利用できるようになりました。
製品内診断 (IPD) では、実行中のインスタンスの動作についてより深いインサイトが得られます。
IPD では、Confluence とそのデータベースの間のやりとりを処理する追加のメトリックを使用します。たとえば、データベース接続メトリックを使用することで、環境やインフラストラクチャでパフォーマンスの問題を発生させる可能性のある要素を効率的に特定できます。
この機能は既定で有効になっています。実際のメトリックは次の形式で利用できます。
新しい JMX MBeans として
新しい IPD ログ ファイル (
atlassian-confluence-ipd-monitoring.log) 内の JMX 値のスナップショットの履歴。
ログ ファイルは、Atlassian Troubleshooting and Support アプリで作成されたサポート Zip ファイルにも含まれています。必要に応じて、Zip ファイルをアトラシアン サポートにご送付ください。アトラシアン サポートには、その内容を解釈するための社内ツールがあります。
このログ ファイルは、すべての既存のログ ファイルが格納されている {confluence_home}\logs フォルダにあります。このログ ファイルは、ATST プラグインで作成されるサポート ZIPファイルにも含まれています。必要に応じて、Atlassian troubleshooting & support toolsプラグインでサポート ZIP ファイルを生成し、ファイルをアトラシアン サポートに送信できます (アトラシアン社内にはファイル解釈用のツールがあります)。プラグインの詳細をご確認ください。
コミュニケーション
この機能では通信に次の方法が使用されます。
JMX: JMX MBean は内部スケジュールに基づいて定期的に更新されます。
ログ ファイル
atlassian-confluence-ipd-monitoring.log: JMX 値は、設定可能なスケジュールでスナップショットされ、ログ ファイルに記録されます。既定では、60 秒ごとに JMX 値がポーリングされ、ログ ファイルに書き込まれます。
製品内診断メトリック
次のセクションを展開して、製品内診断で利用できるメトリックの詳細を学習してください。
メトリックを使用するには、最初に必ず JMX を有効にしてください。
製品間のメトリックの詳細は「製品内診断のために製品間指標を解釈する」という記事をご参照ください。
製品内診断モニタリングを有効にする
IPD モニタリングは初期設定で有効になっています。管理する方法は次のとおりです。
[管理] メニュー
から、[一般設定] に移動します。左側のパネルで [モニタリング] を選択します。
[製品内診断を有効化] トグルを使用して、IPD モニタリングを有効または無効にします。
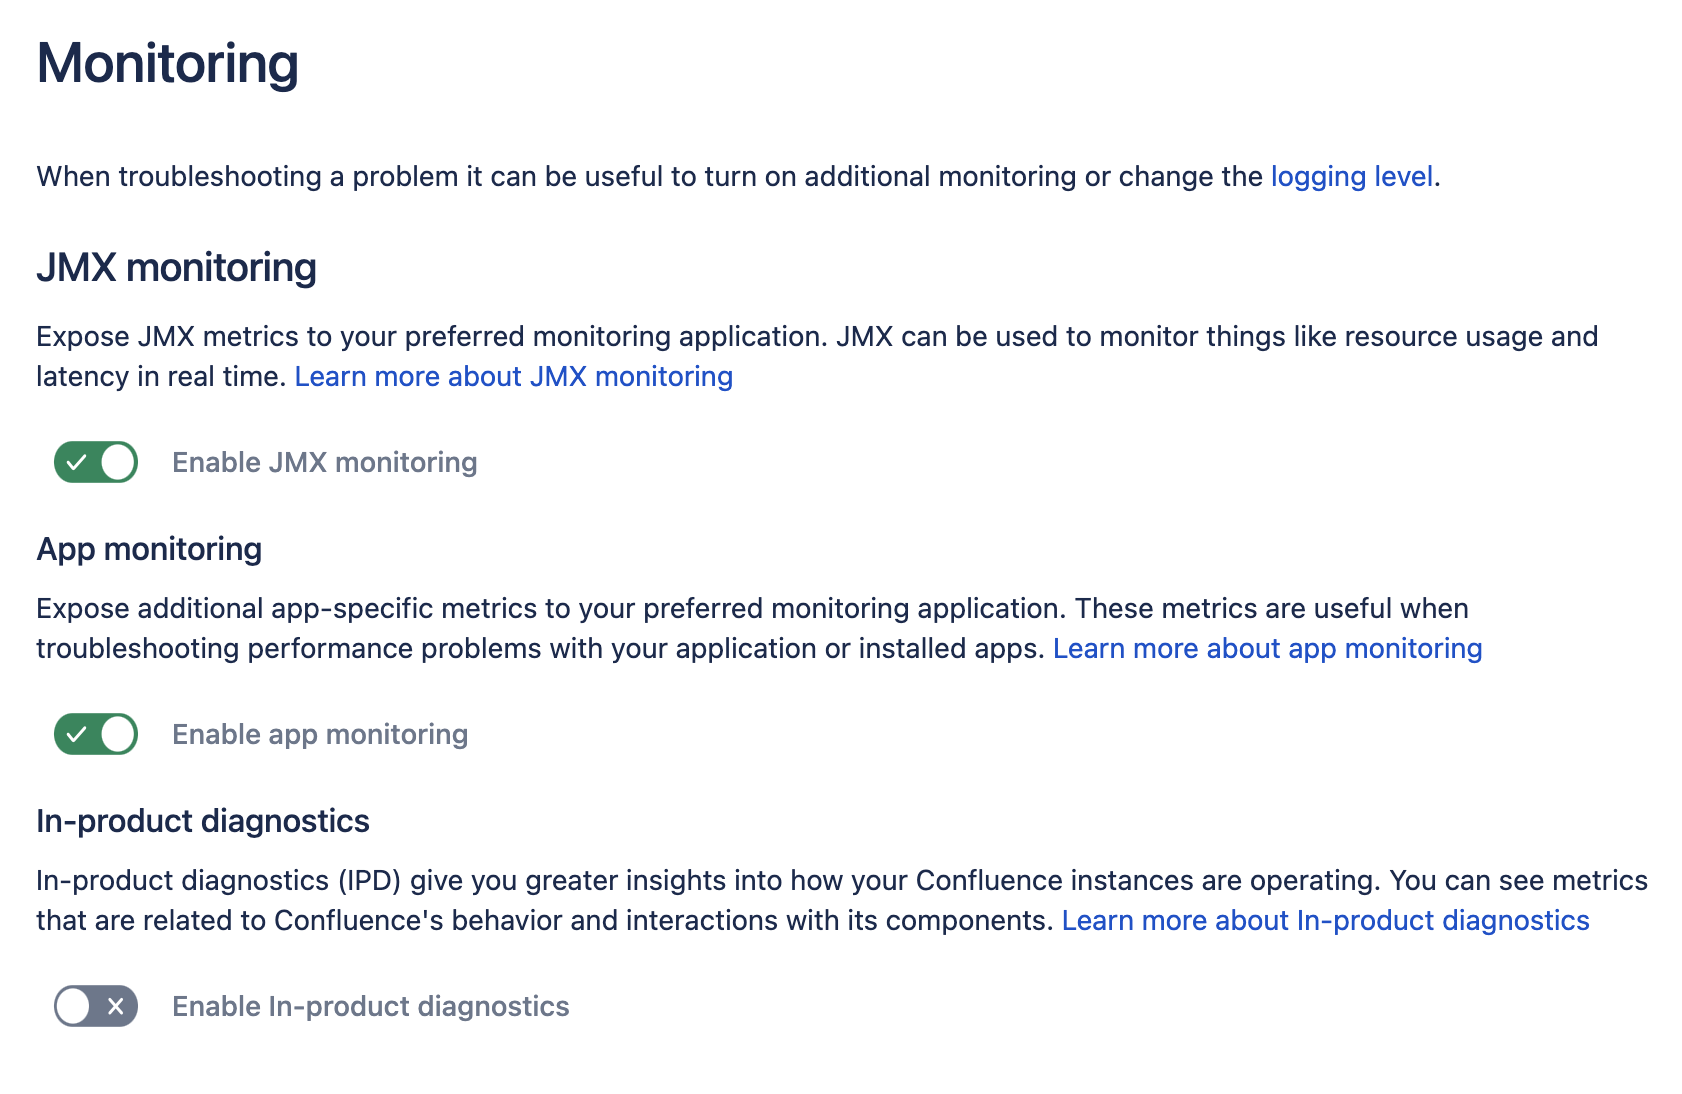
スクリーンショット: 製品内診断が無効になっている JMX モニタリング設定
ログ形式
atlassian-confluence-ipd-monitoring.log への書き込みは log4j を使用して行われます。その設定は log4j.properties で管理します。
#####################################################
# In-product diagnostics monitoring logging
#####################################################

log4j.appender.ipdLogAppender=com.atlassian.confluence.logging.ConfluenceHomeLogAppender
log4j.appender.ipdLogAppender.LogFileName=atlassian-confluence-ipd-monitoring.log
log4j.appender.ipdLogAppender.MaxFileSize=20480KB
log4j.appender.ipdLogAppender.MaxBackupIndex=5
log4j.appender.ipdLogAppender.layout=com.atlassian.logging.log4j.NewLineIndentingFilteringPatternLayout
log4j.appender.ipdLogAppender.layout.ConversionPattern=%d %m%n

log4j.logger.ipd-monitoring = INFO, consolelog
log4j.additivity.ipd-monitoring = false
log4j.logger.ipd-monitoring-data-logger = INFO, ipdLogAppender
log4j.additivity.ipd-monitoring-data-logger = false
ログの内容
初期設定では、各ログ エントリに簡潔データ セットが含まれています。拡張データ セットをログに記録するには、confluence.in.product.diagnostics.extended.logging 機能フラグを有効にします。
拡張データを有効にするには、次の手順に従います。
<CONFLUENCE_URL>/admin/darkfeatures.actionに移動します。ここで、<CONFLUENCE_URL>は Confluence インスタンスのベース URL です。[Enable dark feature (ダーク機能を有効)] フィールドに
confluence.in.product.diagnostics.extended.loggingと入力します。[送信] を選択します。ダーク機能の管理方法をご確認ください。
拡張データを無効にするには、[サイトのダーク機能] セクションで、c
onfluence.in.product.diagnostics.extended.loggingを探して [削除] を選択します。
次の各表で、簡潔ログ形式と拡張ログ形式の構造をご確認ください。
JMX のメトリックは常に拡張形式です。
簡潔データ
MBean タイプ | Properties | 属性 |
|---|---|---|
カウンター | timestamp ラベル 属性 | _count |
値 | _value | |
統計 | _99thPercentile _max _min _mean |
拡張データ
MBean タイプ | Properties | 属性 |
|---|---|---|
カウンター | timestamp ラベル 属性 オブジェクト名 | _count _fifteenMinuteRate _fiveMinuteRate _meanRate _oneMinuteRate _rateUnit |
値 | _value _number | |
統計 | _50thPercentile _75thPercentile _95thPercentile _98thPercentile _99thPercentile _999thPercentile _count _min _max _mean _stdDev _durationUnit _fifteenMinuteRate _fiveMinuteRate _meanRate _oneMinuteRate _rateUnit |
指標属性の定義
指標属性の詳細は、次のセクションを展開してご確認ください。