Diagnostics for third-party apps
Bitbucket Data Center と Server の管理
- Users and groups
- 高度なリポジトリ管理
- 外部ユーザー ディレクトリ
- グローバル権限
- Setting up your mail server
- アトラシアン アプリケーションとの連携
- Connect Bitbucket to an external database
- Migrating Bitbucket Server to another server
- Migrate Bitbucket Server from Windows to Linux
- Run Bitbucket in AWS
- Specify the Bitbucket base URL
- Configuring the application navigator
- アプリの管理
- 監査ログの表示と設定
- Update your license key
- Configuration properties
- Bitbucket のコンテキスト パスを変更する
- Data recovery and backups
- Git リポジトリへの HTTP(S) アクセスの無効化
- スマート ミラーリング
- Bitbucket Mesh
- プロジェクトとリポジトリのエクスポートとインポート
- Git Large File Storage
- Git Virtual File System (GVFS)
- Git リポジトリへの SSH アクセスを有効にする
- シークレット スキャン
- Use diff transcoding
- Change the port Bitbucket listens on
- Lockout recovery process
- プロキシとセキュアな Bitbucket
- High availability for Bitbucket
- Diagnostics for third-party apps
- Enabling JMX counters for performance monitoring
- Bitbucket guardrails
- Enable debug logging
- Bitbucket Server の拡張
- Add a shortcut link to a repository
- Administer code search
- Adding additional storage for your repository data
- Add a system-wide announcement banner
- アプリケーションを横断したプロジェクト リンクの構成
- レート制限でインスタンスの安定性を改善する
- Atlasssian Data Center アプリケーションで CDN を使用する
- Managing HTTP access tokens
- 他のアプリケーションにリンクする
- Setting a system-wide default branch name
- 非アクティブなプル リクエストを自動的に却下
- データベース パスワードの暗号化
- データ パイプライン
- アプリケーション パフォーマンスを監視する
このページの内容
このセクションの項目
関連コンテンツ
- Creating release notes
- Portfolio for Jira Plan macro displays an empty panel with a 'refused to connect' message
- How to configure default Release Notes in JIRA
- FishEye 3.1 release notes
- Portfolio Plan is slow to interact with when loading many releases
- Release Notes page is Blank in Project Summary
- Jira Software documentation
- Migration guide
- Jira Report Blueprint
概要
The Bitbucket Data Center and Server diagnostics tool displays a summary of the alerts that have been raised on the instance in the past 30 days, grouped by issue and app combination.
There are three levels of severity:
- Error: a serious problem has occurred that impacts system stability and/or availability
- Warning: an issue has been detected that impacts performance or can lead to more serious problems in the future
- Info: something worth noting has happened.
The alerts can be filtered by severity, component, app, node and time.
Alert Details
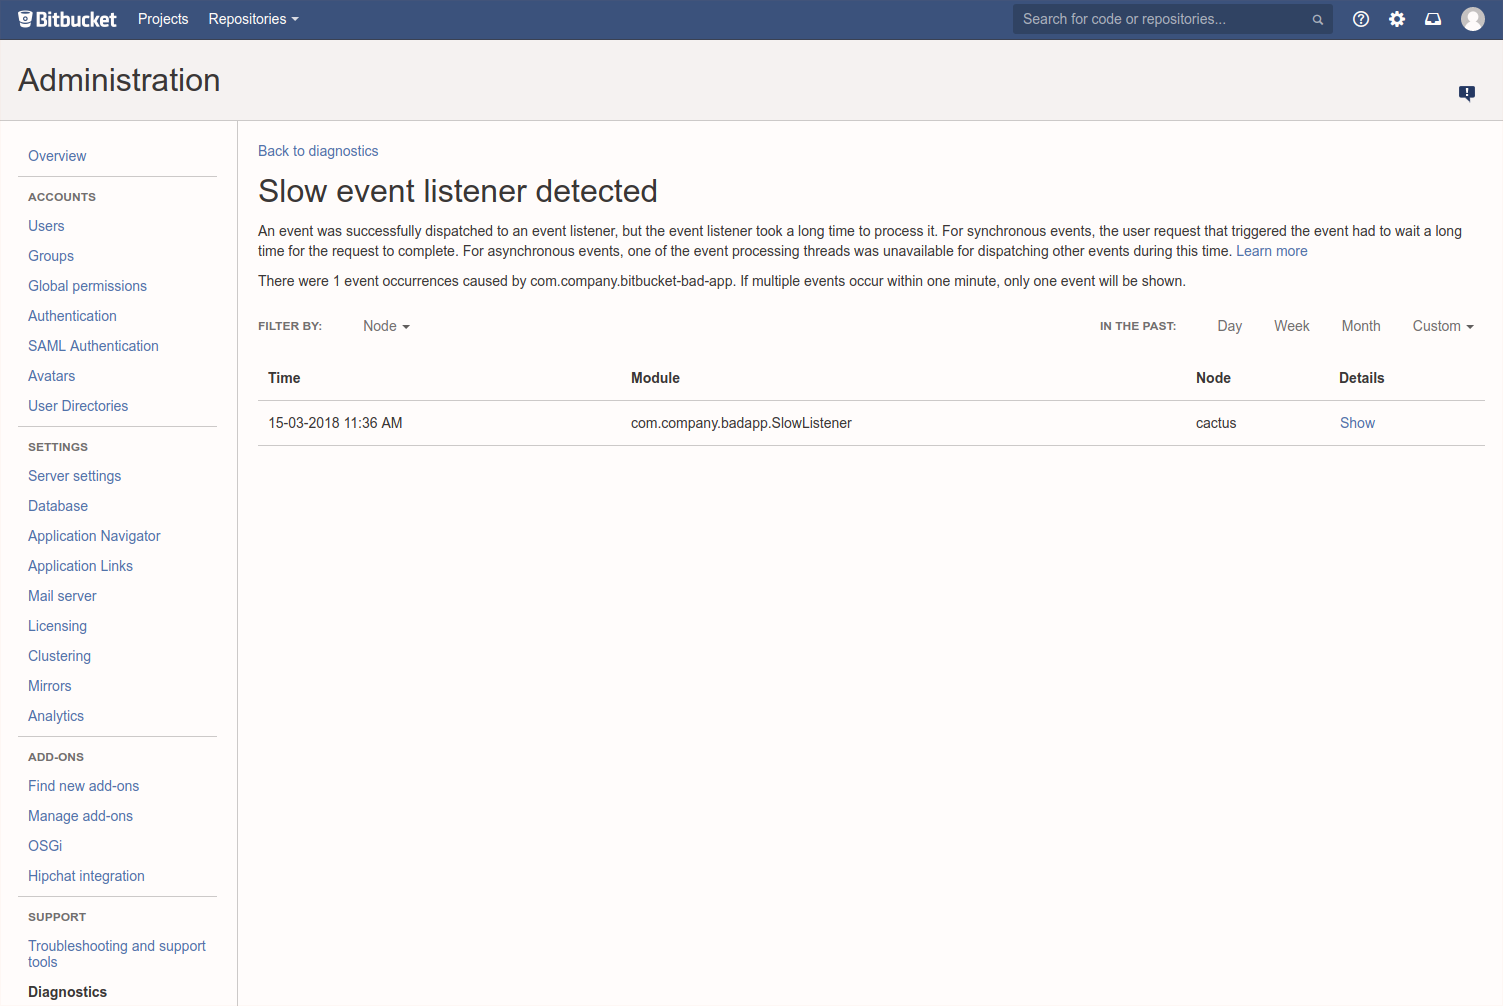
The alert details page is accessed by clicking into an alert, and displays individual alerts for the selected issue and app combination.
When many alerts are raised in a short time window, just one representative alert is displayed per 1 minute window.
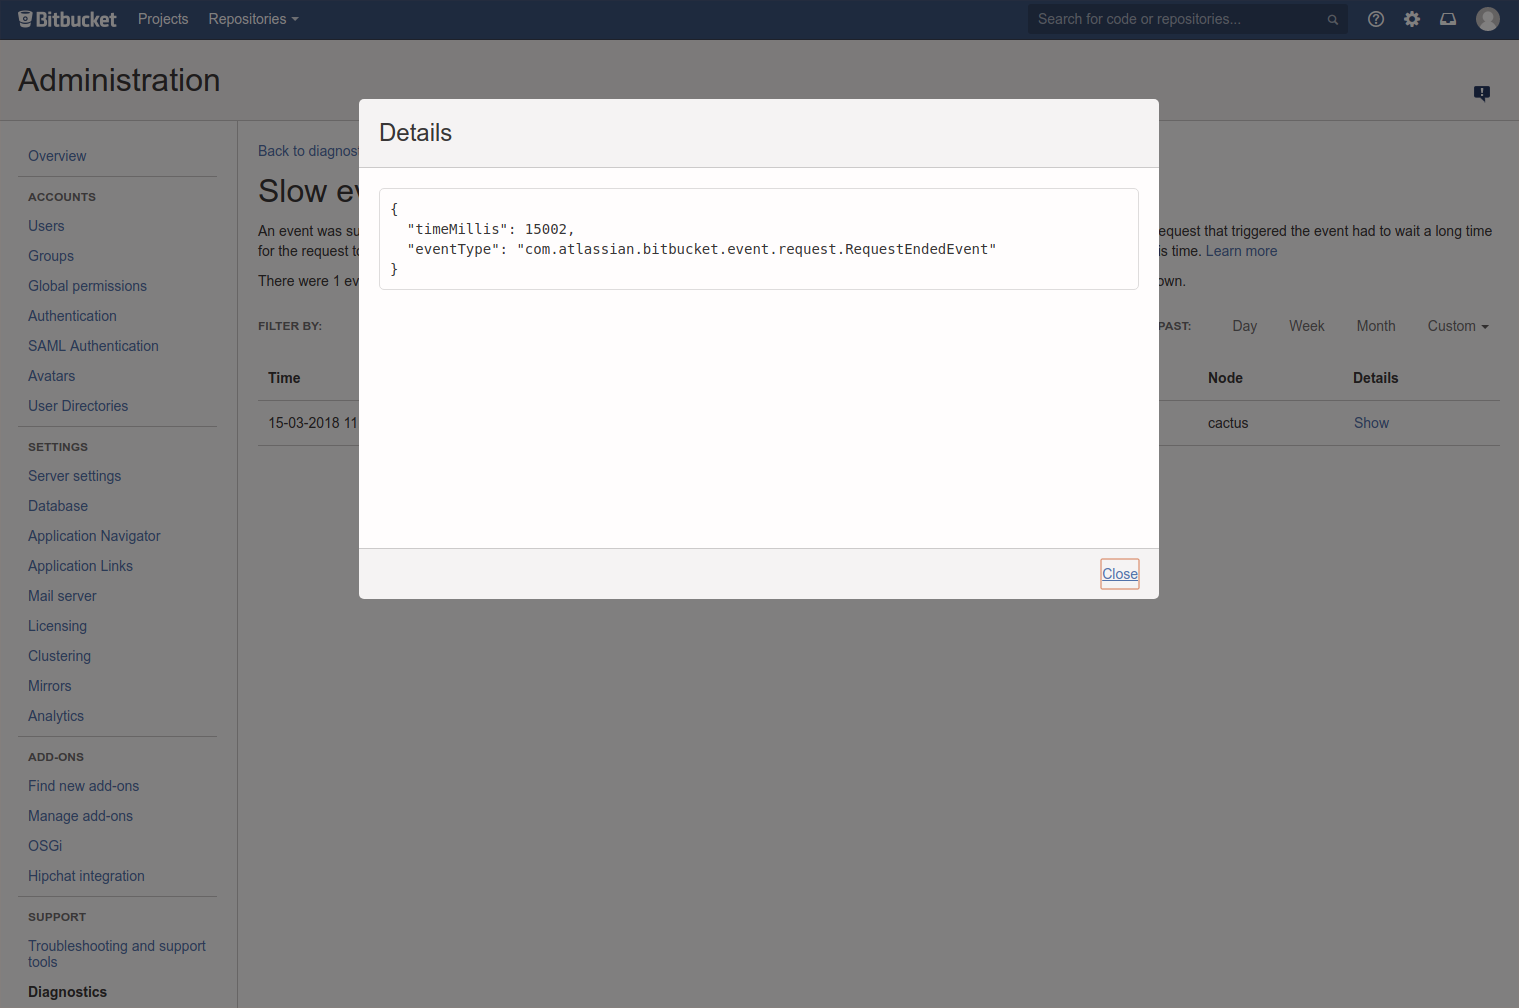
Clicking Show displays information relating to the issue, that was collected when the alert was raised.
You can also set up alerts using JMX metric details.
最終更新日: 2022 年 10 月 4 日
このセクションの項目
関連コンテンツ
- Creating release notes
- Portfolio for Jira Plan macro displays an empty panel with a 'refused to connect' message
- How to configure default Release Notes in JIRA
- FishEye 3.1 release notes
- Portfolio Plan is slow to interact with when loading many releases
- Release Notes page is Blank in Project Summary
- Jira Software documentation
- Migration guide
- Jira Report Blueprint
Powered by Confluence and Scroll Viewport.