レポートを扱う
動的レポートによって、オブジェクト スキーマに関する情報をさまざまな形式で表示できます。既定のレポート タイプのいずれかに基づいてレポートを作成できます。
レポートの作成
- 上部のナビゲーション バーで [Insight] > [レポート] の順に選択します。
- [新規レポート] をクリックします。

レポートの作成を開始すると、レポート マネージャーに表示されます。ここでは、レポートを並べ替えて絞り込む、レポートを印刷、共有、同期するなど、さまざまな操作を行えます。レポートで利用可能なアクションのリストを表示するには、各レポートの横にある [オプション] を選択します。
レポート タイプ
ここでは、Insight で作成できるすべてのレポート タイプを紹介します。
| レポート | 説明 | 例 |
|---|---|---|
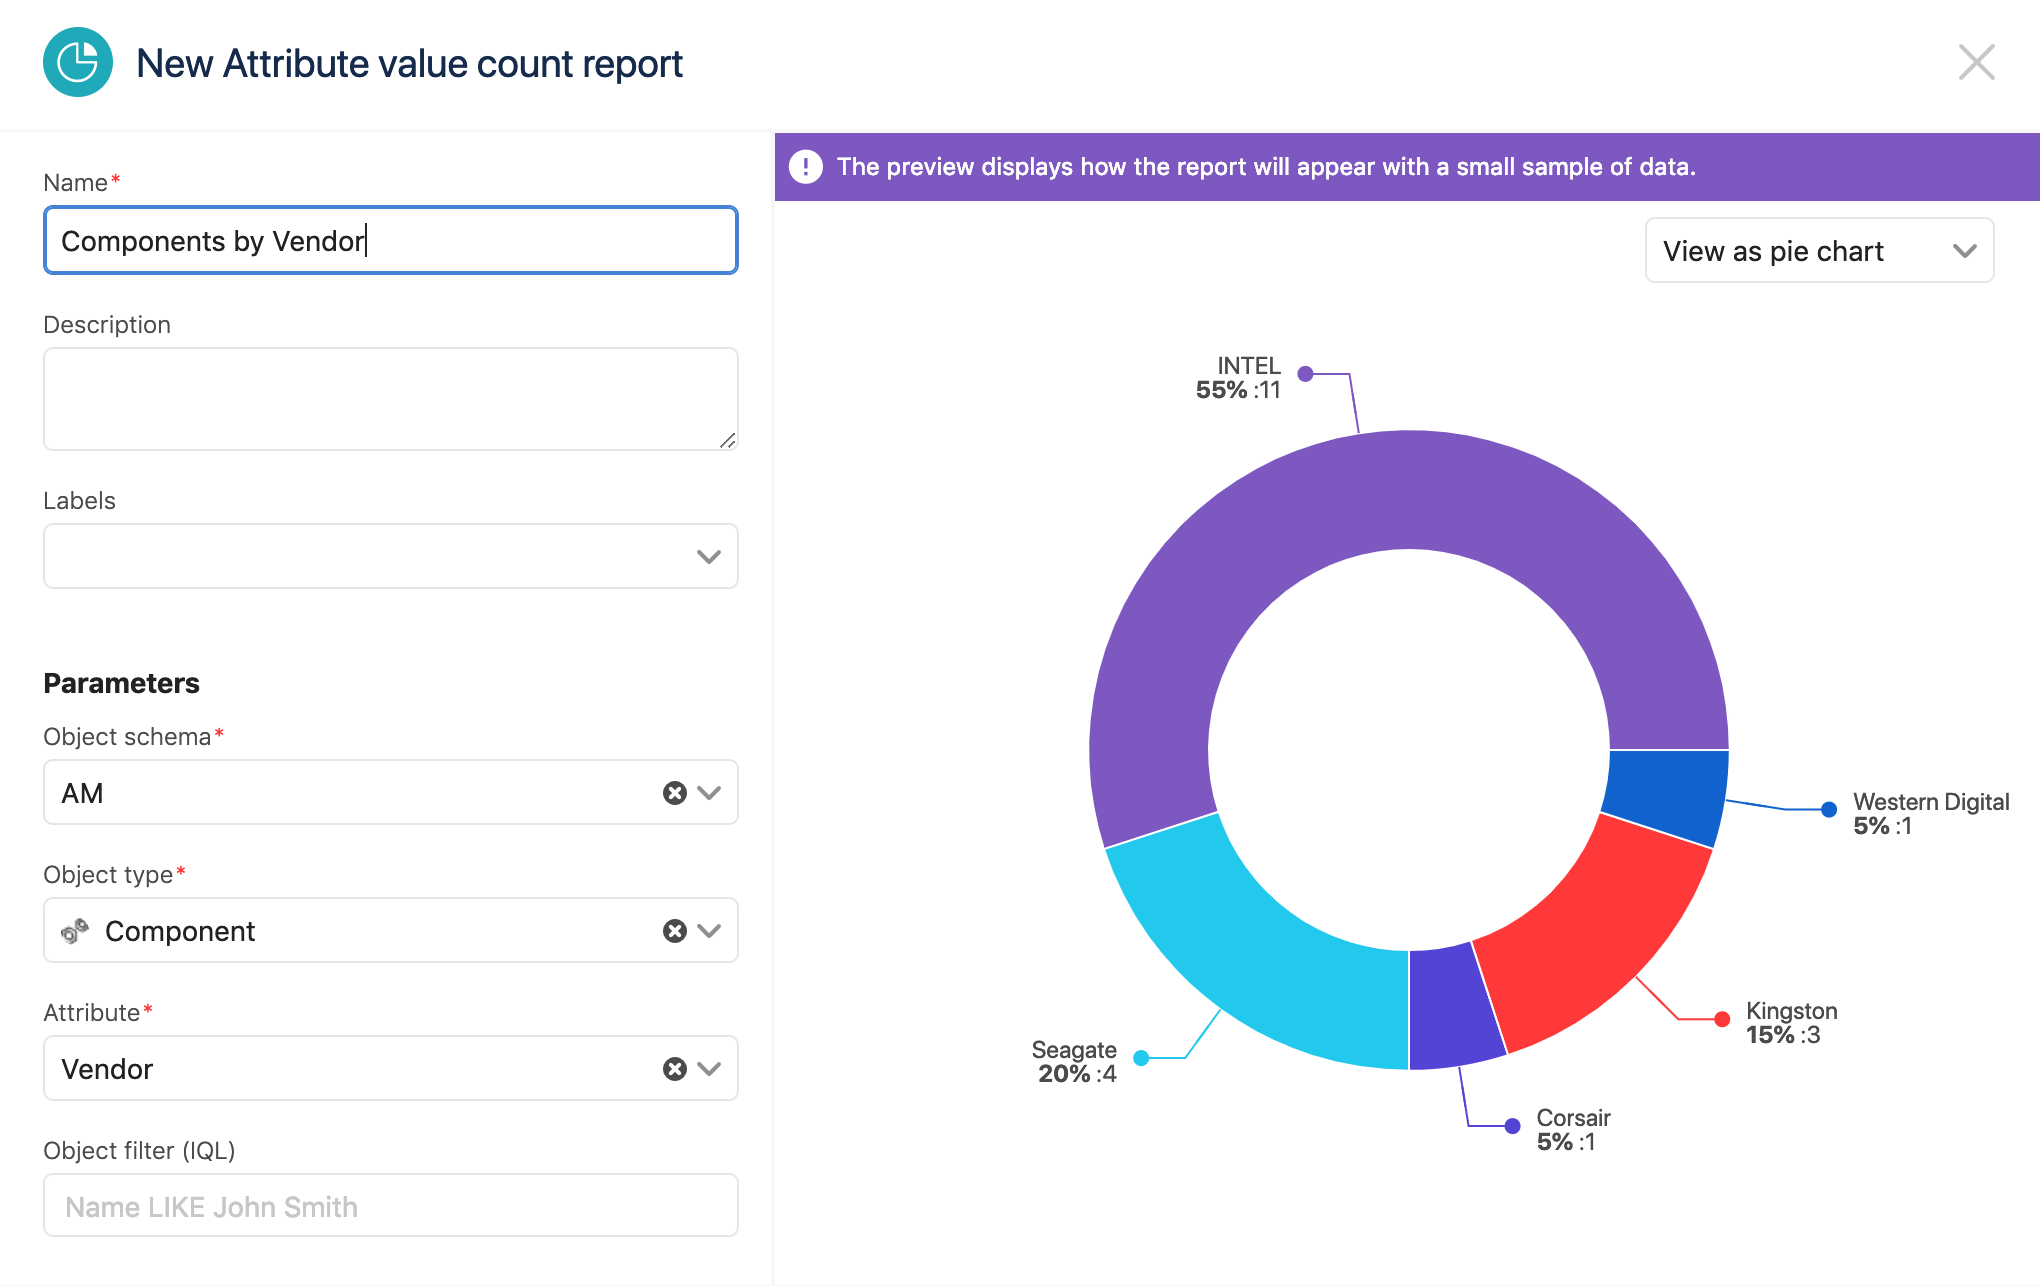
| 属性値カウント レポート | 円グラフ。オブジェクト タイプのオブジェクトが属性に基づいてどのように分布しているかを示します。 |
|
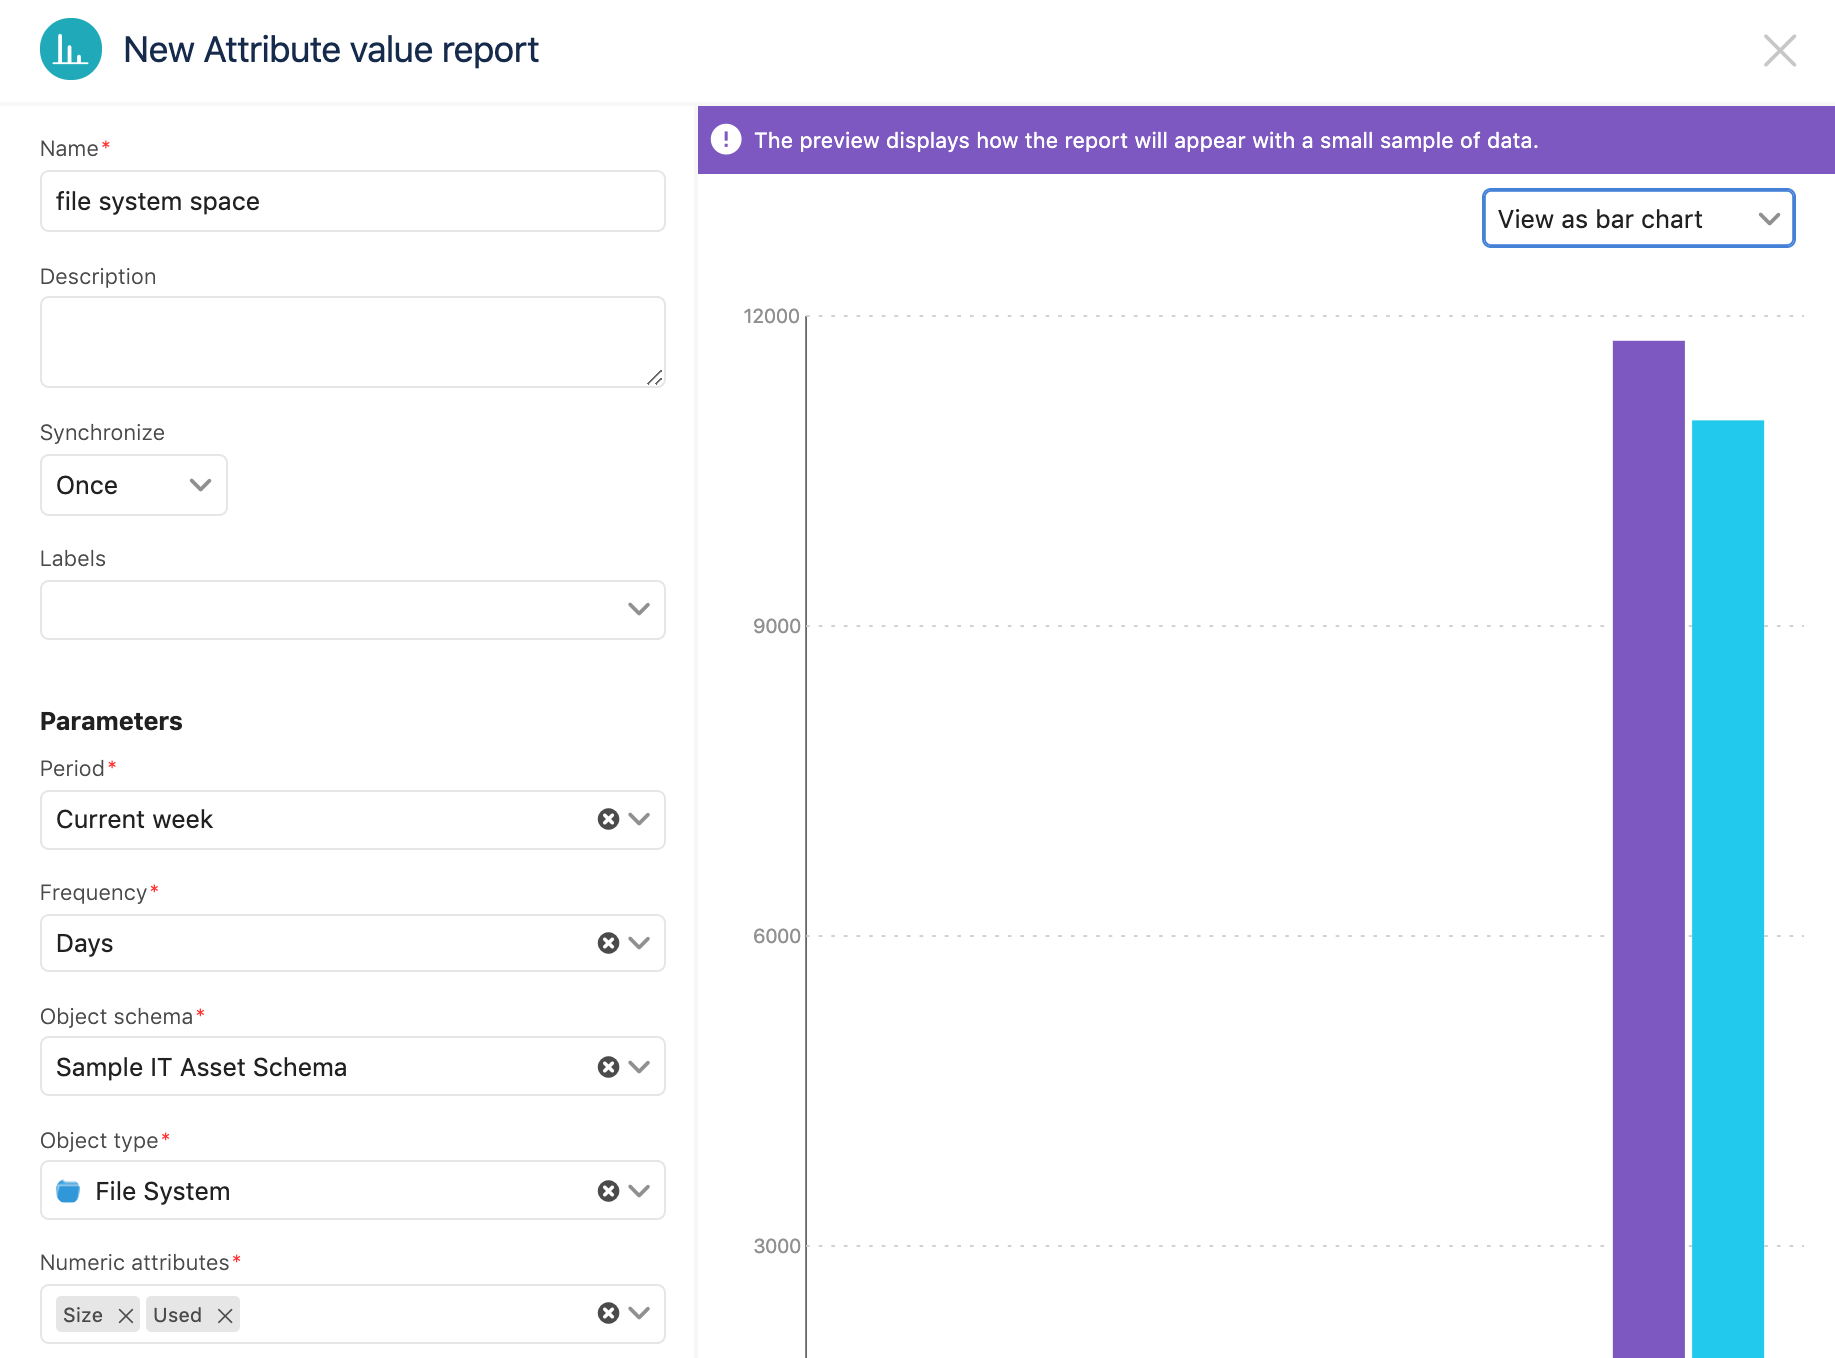
| 属性値レポート | グラフ。特定のタイプの 1 つ以上のオブジェクトについてレポートされた属性の合計を示します。 |
|
| カタログ レポート | オブジェクトとその属性のカタログ。 |
|
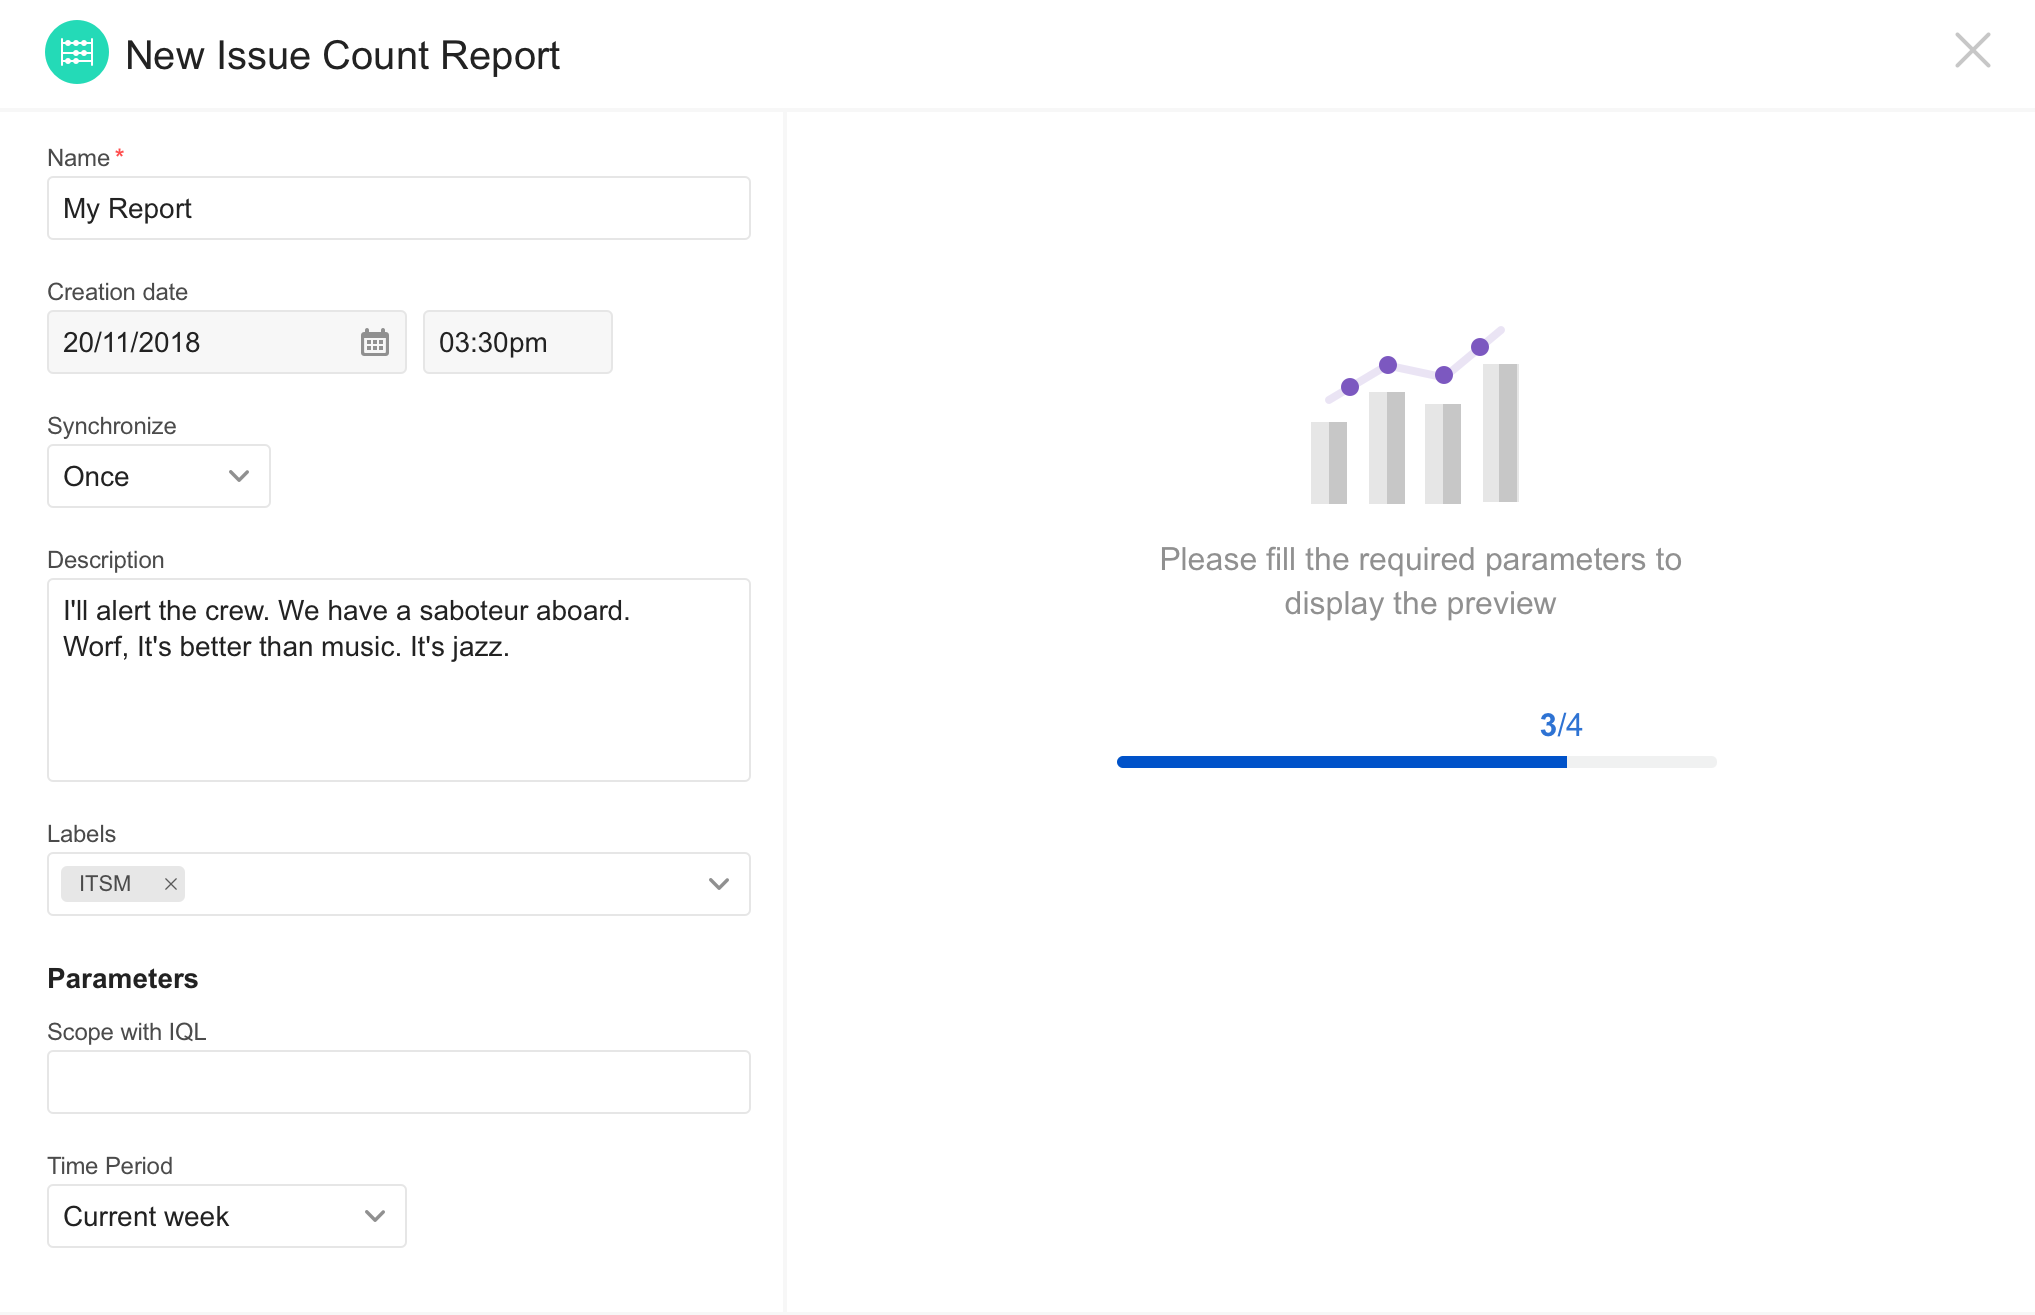
| 課題数レポート | 折れ線グラフまたは線グラフ。1 つ以上のオブジェクト タイプまたはオブジェクトについて報告された課題のこれまでの合計を示します。 |
|
| マップ レポート | 地理データを含む属性に基づいてオブジェクトの位置を示す世界地図。 |
|
| オブジェクト数レポート | 1 つ以上のオブジェクト タイプのオブジェクトの履歴合計を示した折れ線グラフ。 |
|
| ペイロール レポート | ペイロール支出を示すグラフ。 |
|
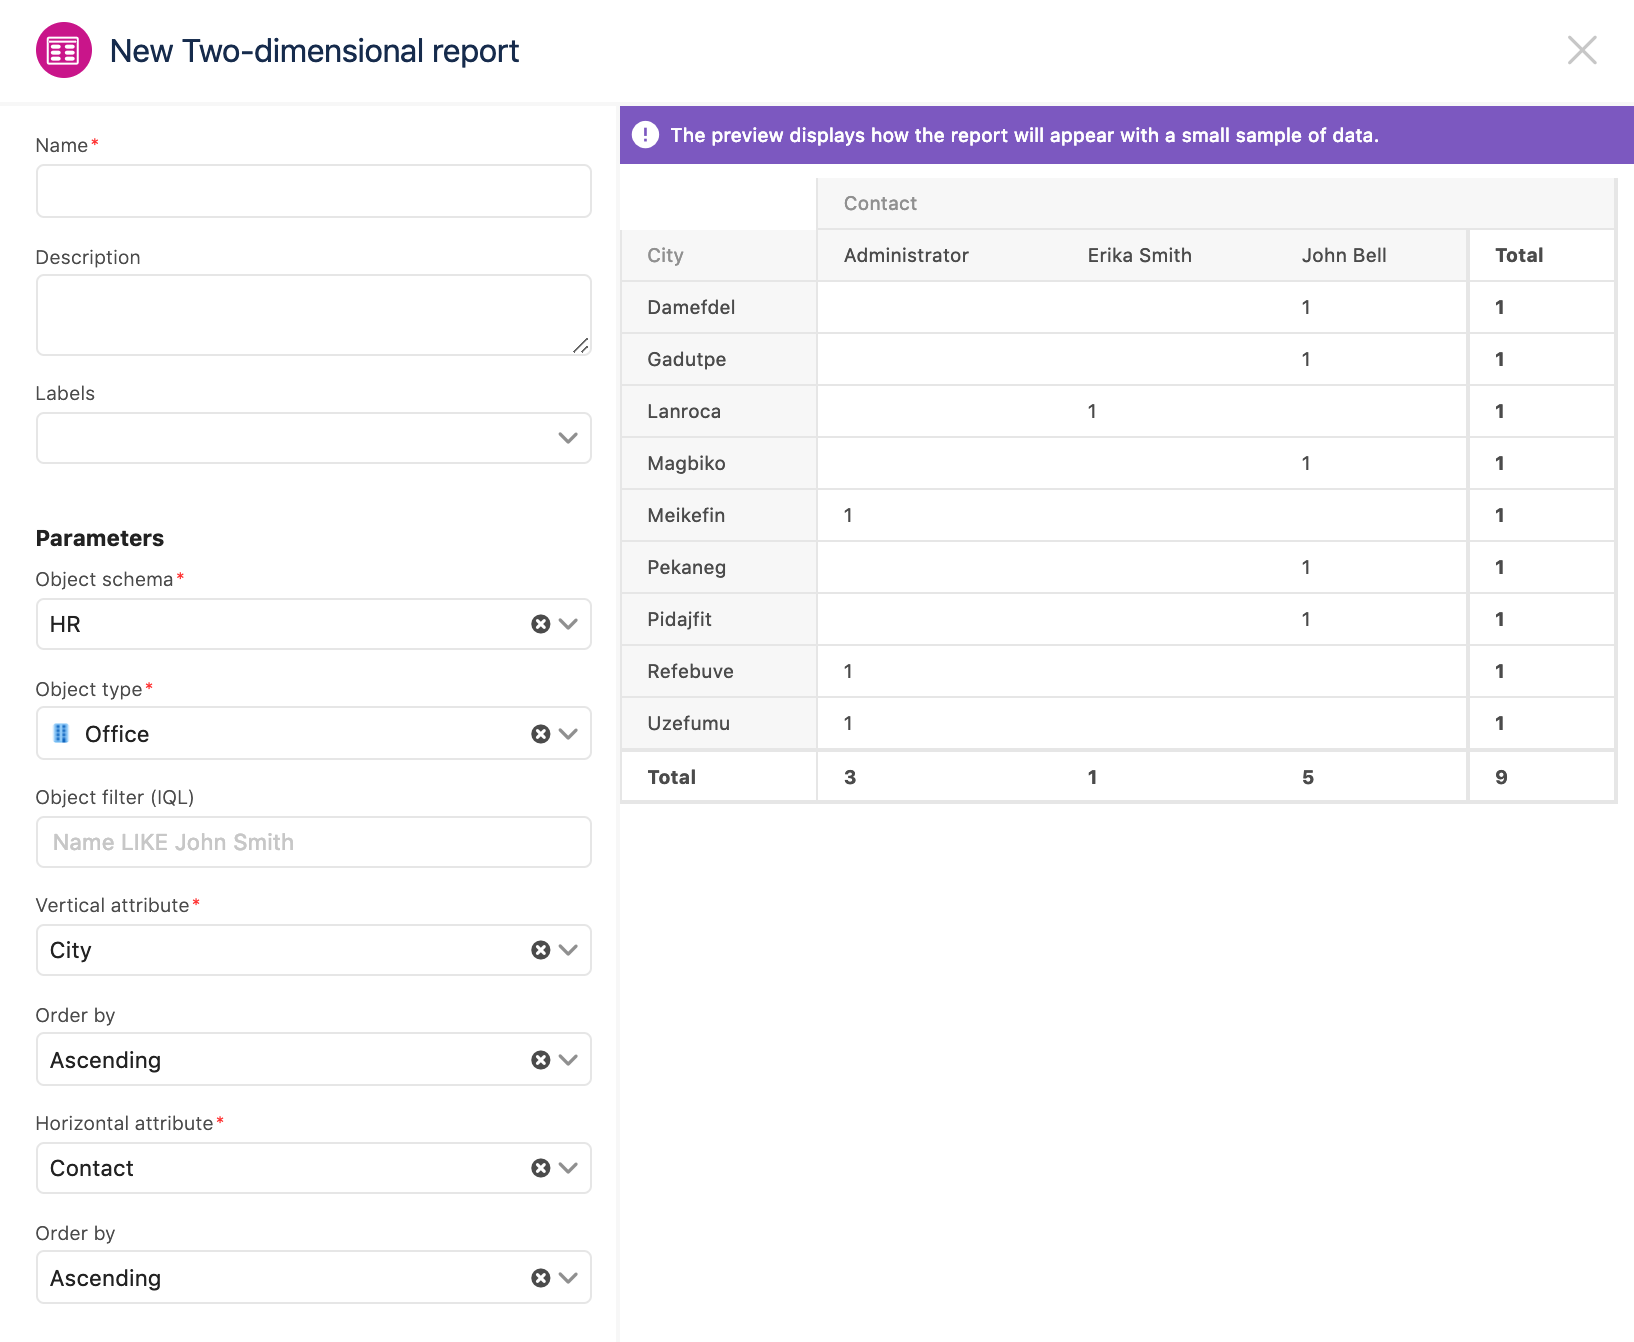
| 二次元レポート | オブジェクト タイプのオブジェクトとその属性を示すテーブルを返します。 |
|
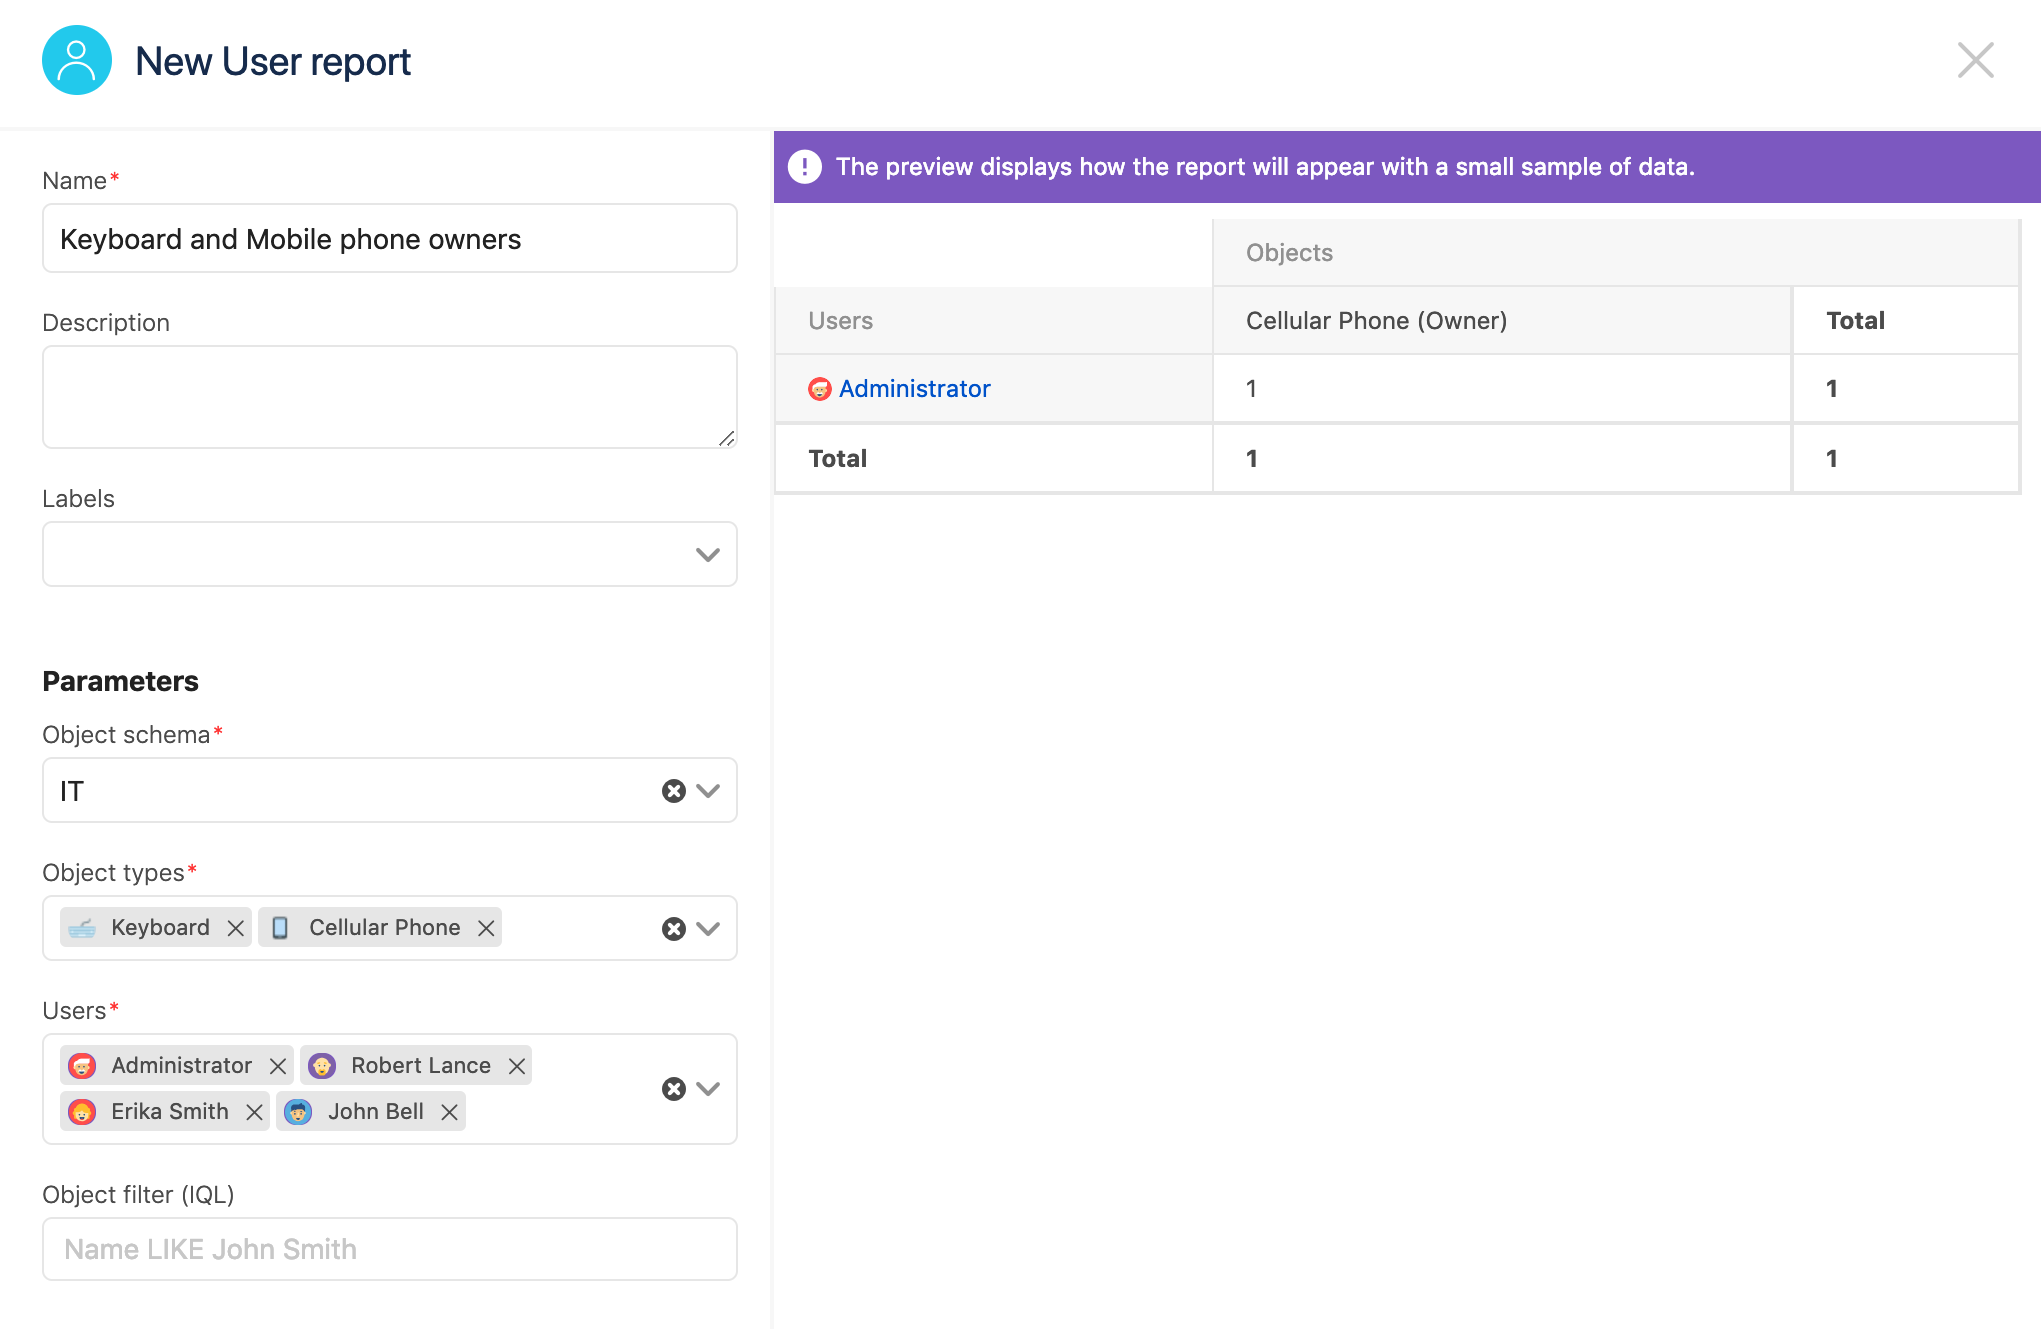
| ユーザー レポート | 1 人以上のユーザーに割り当てられた 1 つ以上のオブジェクトの合計を示すテーブルを返します。 |
|
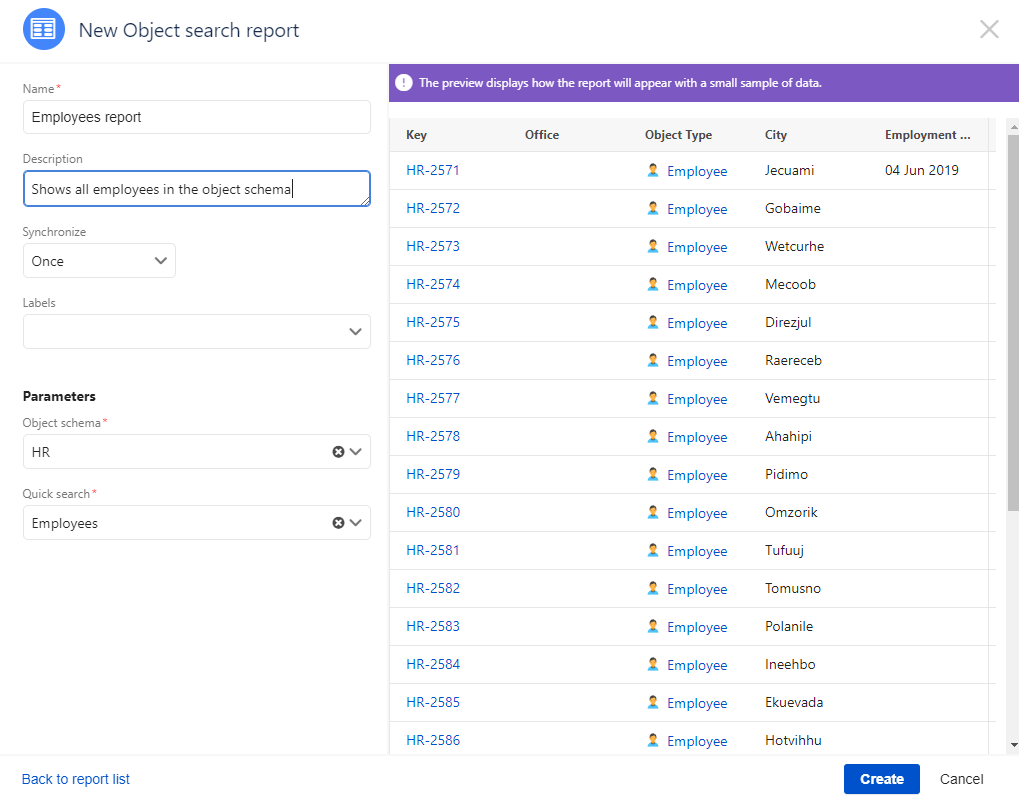
| オブジェクト検索 | レポートは [Insight オブジェクト検索] ビューに保存されたクイック検索 (フィルター) に基づいていて、オブジェクト タイプのオブジェクトとその属性を示すテーブルです。オブジェクト検索レポートを開くと、[クイック検索] リンクをクリックしてテーブルを生成するフィルターを表示できます。 |
|


最終更新日: 2021 年 10 月 19 日
Powered by Confluence and Scroll Viewport.