JIRA Software 7.6 Long Term Support release performance report

このページの内容

お困りですか?

アトラシアン コミュニティをご利用ください。

コミュニティに質問

This page compares the performance of JIRA 7.2 and JIRA 7.6 Long Term Support release. 

About Long Term Support releases
We recommend upgrading JIRA regularly, however if your organisation's process means you only upgrade about once a year, upgrading to a Long Term Support release may be a good option, as it provides continued access to critical security, stability, data integrity and performance issues until this version reaches end of life. 

パフォーマンス

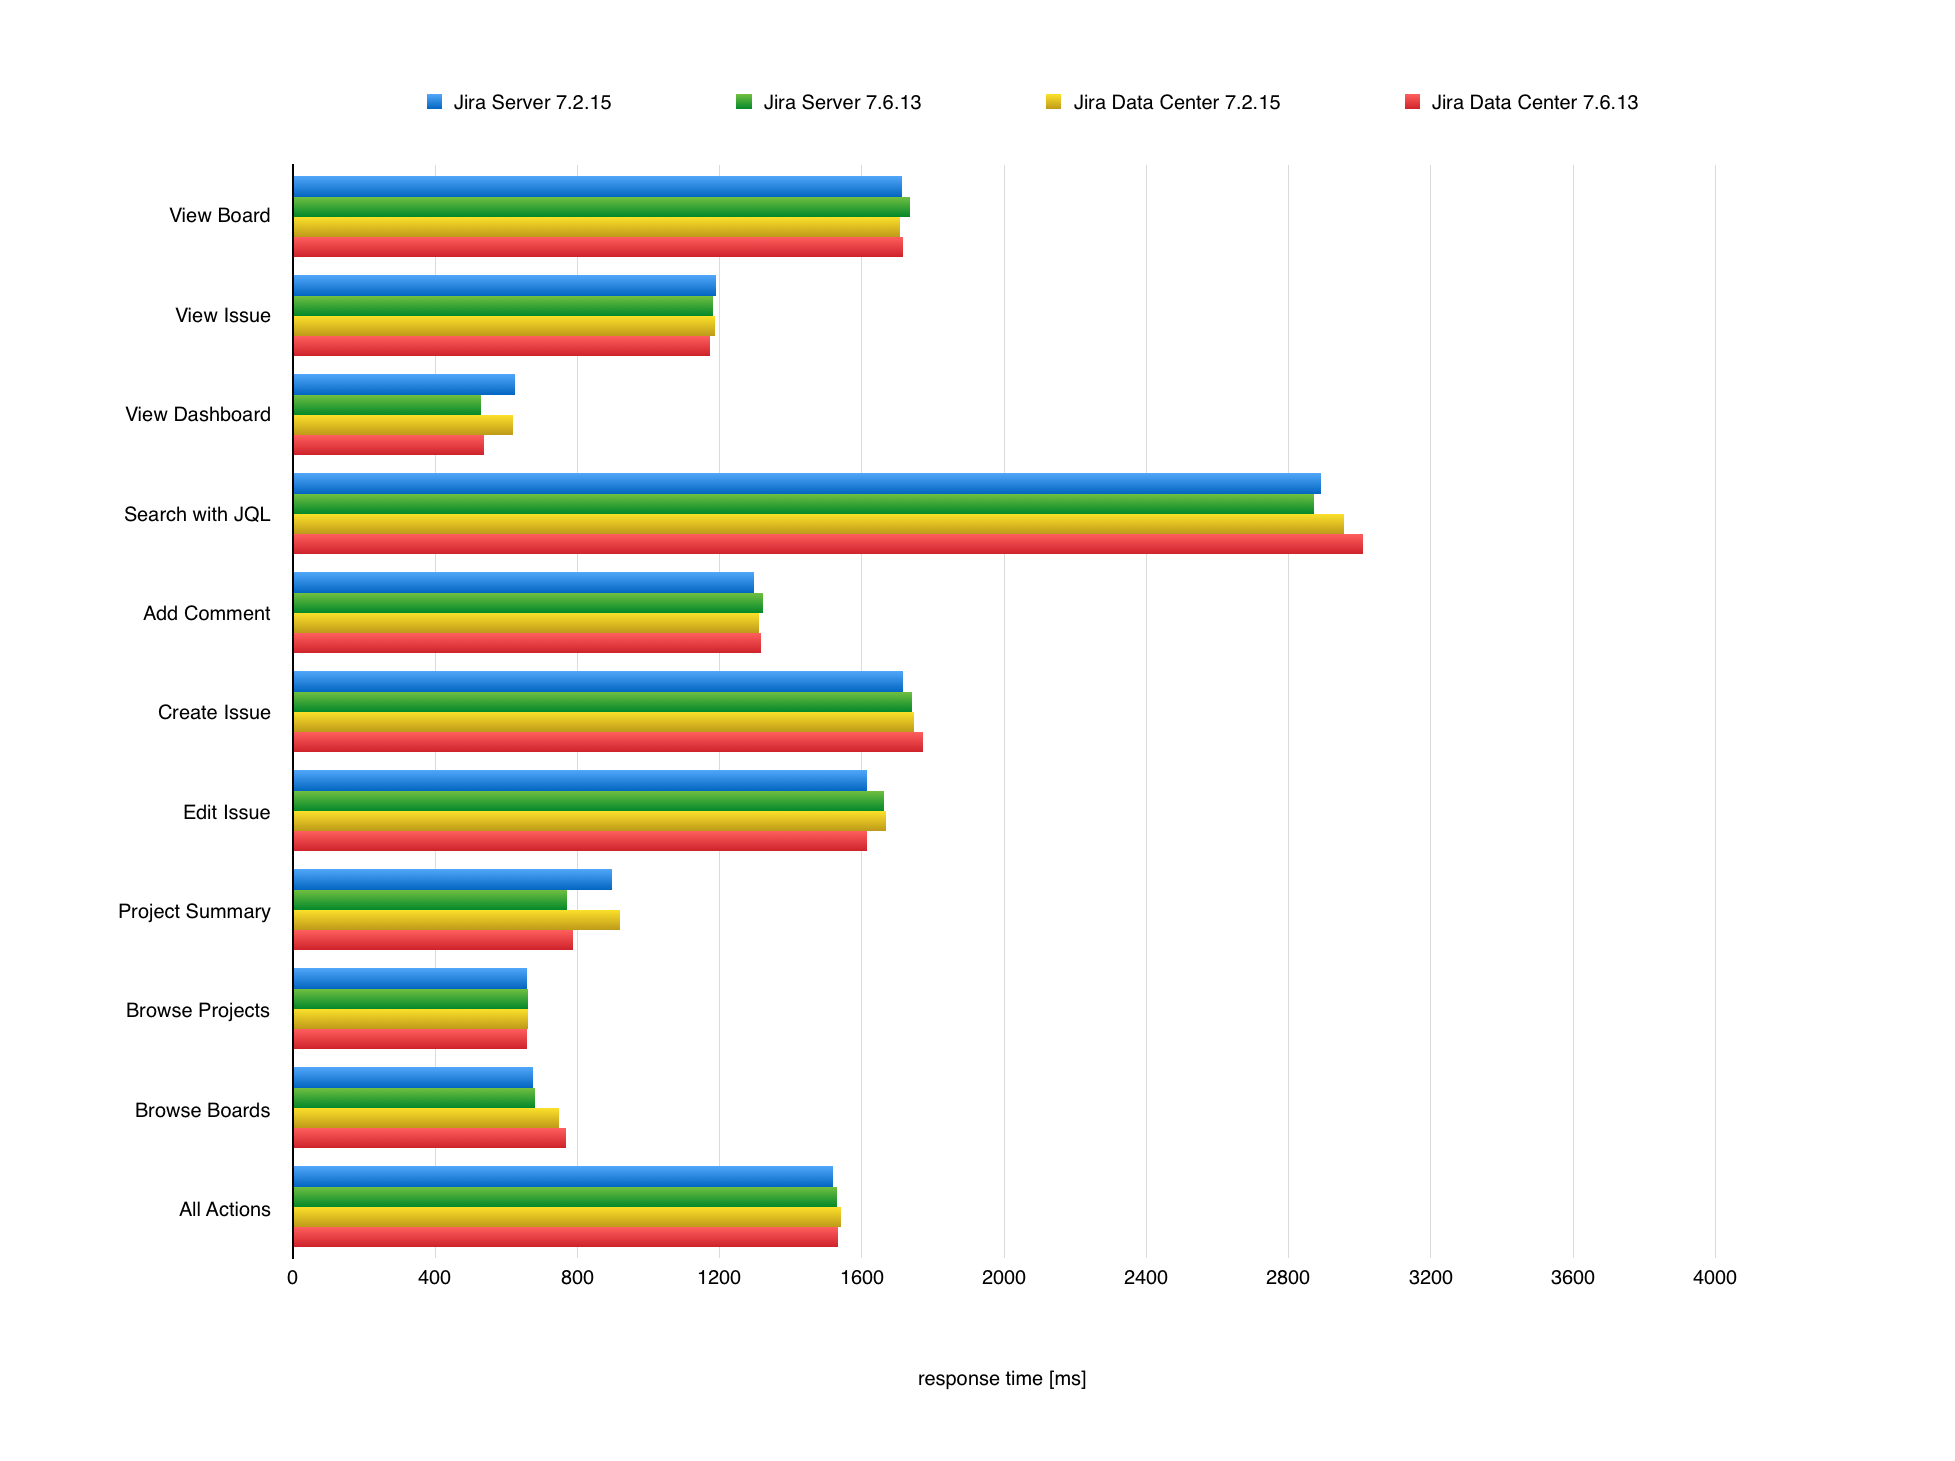
JIRA 7.6 was not focused solely on performance, however we do aim to provide the same, if not better, performance with each release. In this section, we’ll compare JIRA 7.2 to JIRA 7.6 Long Term Support release, both Server and Data Center. We ran the same extensive test scenario for both JIRA versions. 

The following chart presents mean response times of individual actions performed in JIRA. To check the details of these actions and the JIRA instance they were performed in, see Testing methodology.

JIRA 操作の応答時間

テスト手法

以下のセクションでは、当社のパフォーマンス テストで使用するテスト環境 (ハードウェア仕様を含む) とテスト方法を詳しく説明します。

テスト方法...

Before we started the test, we needed to determine what size and shape of data set represents a typical large JIRA instance. To achieve that, we used our Analytics data to form a picture of our customers' environments and what difficulties they face when scaling JIRA in a large organization.

次の表では、各データ ディメンションの 999 番目のパーセンタイルの値を切り捨てています。これらの値を使用して、JIRA Data Generator でランダム テスト データが入ったサンプル データセットを生成します。

Baseline JIRA data set

JIRA data dimension
課題1,000, 000
プロジェクト1500
カスタム フィールド1400
ワークフロー450
添付ファイル660,000
コメント2,900, 000
アジャイルボード1,450
ユーザー100,000
グループ22,500
セキュリティ レベル170
権限200
実行した操作...

We chose a mix of actions that would represent a sample of the most common user actions. An action in this context is a complete user operation like opening of an Issue in the browser window. The following table details the actions that we included in the script for our testing persona, indicating how many times each action is repeated during a single test run.

操作名説明 1 回のテストの間に操作を実行した回数
ダッシュボードの表示ダッシュボード ページを開く。10
課題の作成課題の作成ダイアログを送信する5
課題の表示別のブラウザー ウィンドウで個別の課題を開く。55
課題の編集既存のフィールドのサマリー、説明およびその他のフィールドを編集する。5
コメントを追加課題へのコメント追加。2
JQL の検索

課題ナビゲーター インターフェイスで JQL を使用して検索クエリを実行する。

次の JQL クエリが使用されました。
description ~ 'totally' or summary ~ 'hobos' and comment !~ 'propel' ORDER BY key
reporter was in (admin) and status = Closed order by createdDate


comment ~ 'contest* saw' and reporter was admin order by assignee desc


text ~ 'a* ba*' ORDER BY Status, summary


priority was in (Low, Lowest) or (status = 'In Progress' and assignee changed) or createdDate > '2016/07/02 00:00'


resolution = Unresolved and priority = Low


text ~ 'witch* doctrine' and status was not Closed order by priority


project = novemcinctus and assignee = admin ORDER BY assignee


assignee in membersOf('users_1') order by project


not (status = closed and resolution = Done and priority = High)

これらのクエリの半数は非常に重いため、平均応答時間の高さの原因となっています。

10
ボードの表示Agile Board を開く10
プロジェクトの参照プロジェクトのリストを開く (プロジェクト > すべてのプロジェクトの検索メニューから利用できます)5
ボードの参照Agile Boards のリストを開く (Agile > ボードの管理メニューから利用できます)2
すべての操作1 回のテスト実行中に実行されたすべての操作の平均。-
テスト環境...

The performance tests were all run on a set of AWS EC2 instances. For each test, the entire environment was reset and rebuilt, and then each test started with some idle cycles to warm up instance caches. Below, you can check the details of the environments used for JIRA Server and JIRA Data Center, as well as the specifications of the EC2 instances.

テストを実行するため、スクリプトを組んだブラウザを 10 個使用し、操作の実行にかかる時間を計測しました。各ブラウザーのスクリプトは、定義済みの操作リストからランダムに操作を実行し、すぐに次の操作に移る(つまり思考時間がゼロになる)ように記述されています。これによって各ブラウザは実際のユーザーが可能なタスクよりも実質的に多くのタスクを実行するため、ブラウザの数が実際の同時実行ユーザー数と等しくなると解釈することはできません。

各テストは 20分間実行され、その後、統計情報が収集されます。 

ここでは、テスト環境の詳細について説明します。

JIRA ServerJira Data Center

The environment with JIRA Server consisted of:

  • 1 JIRA node
  • 別のノード上にあるデータベース
  • 別のノード上にあるロード ジェネレーター

The environment with JIRA Data Center consisted of:

  • 2 つの Jira ノード
  • 別のノード上にあるデータベース
  • 別のノード上にあるロード ジェネレーター
  • 別のノード上にある共有ホーム ディレクトリ
  • ロード バランサ (AWS ELB HTTP ロード バランサ)
Jira
ハードウェアソフトウェア
EC2 タイプ:

c4.8xlarge (EC2 タイプを参照)  

JIRA Server: 1 node

JIRA Data Center: 2 nodes

オペレーティング システム: Ubuntu 16.04 LTS
CPU: Intel Xeon E5-2666 v3 (Haswell) Java プラットフォーム: Java 1.8.0
CPU コア:36 Java オプション:

8 GB heap


メモリ60 GB
ディスク: AWS EBS 100 GB gp2
データベース
ハードウェアソフトウェア
EC2 タイプ: c4.8xlarge (see EC2 types)   データベース:MySQL 5.5
CPU: Intel Xeon E5-2666 v3 (Haswell) オペレーティング システム:


Ubuntu 16.04 LTS


CPU コア:36
メモリ60 GB
ディスク:

JIRA Server: AWS EBS 100 GB gp2

JIRA Data Center: AWS EBS 60 GB gp2

ロード ジェネレーター
ハードウェアソフトウェア
EC2 タイプ: c4.8xlarge (see EC2 types)   オペレーティング システム: Ubuntu 16.04 LTS
CPU: Intel Xeon E5-2666 v3 (Haswell)ブラウザ: Google Chrome 62


CPU コア:36自動化スクリプト:

Chromedriver 2.33

WebDriver 3.4.0

Java JDK 8u131

メモリ60 GB
ディスク: AWS EBS 30 GB gp2
最終更新日 2020 年 6 月 26 日

この内容はお役に立ちましたか?

はい
いいえ
この記事についてのフィードバックを送信する
Powered by Confluence and Scroll Viewport.