Enabling JMX counters for performance monitoring
This article describes how to expose JMX MBeans within Bitbucket Data Center and Server for monitoring with a JMX client.
Related reading: Understanding JMX (Oracle)
On this page:
JMX とは何か
JMX (Java Management eXtensions) is a technology for monitoring and managing Java applications. JMX uses objects called MBeans (Managed Beans) to expose data and resources from your application.
Why would I want to enable JMX monitoring within Bitbucket?
For large Bitbucket instances, enabling JMX allows you to more easily monitor the consumption of application resources. This enables you to make better decisions about how to maintain and optimize machine resources.
JMX を使用して何を監視できますか?
JMX counters allow you to monitor various statistics across Bitbucket. Select the one that interests you and find out more about it in the document.
Mail statistics (com.atlassian.bitbucket:name=MailStatistics)
Alerts total (com.atlassian.diagnostics:type=Alerts,name=Total)
Plugin (com.atlassian.diagnostics:type=Alerts,Category=Plugin,name=${PLUGIN_NAME})
Issue (com.atlassian.diagnostics:type=Alerts,Category=Issue,name=${ISSUE_ID})
Webhooks statistics (com.atlassian.webhooks:name=Webhooks)
Repositories (com.atlassian.bitbucket:name=Repositories)
SCM statistics (com.atlassian.bitbucket:name=ScmStatistics)
Event statistics (com.atlassian.bitbucket:name=EventStatistics)
Cluster lock statistics (com.atlassian.bitbucket:name=ClusterLocks)
SSH session statistics (com.atlassian.bitbucket:name=SshSessions)
Rate limiting statistics (com.atlassian.bitbucket:name=RateLimitStatistics)
HikariCP (com.zaxxer.hikari:type=Pool (bitbucket))
Hibernate (org.hibernate.core:sessionFactory=bitbucket.core,serviceRole=org.hibernate.stat.Statistics,serviceType=org.hibernate.stat.internal.ConcurrentStatisticsImpl)
Mail performance
Mail statistics (com.atlassian.bitbucket:name=MailStatistics)
| 名前 | 説明 |
|---|---|
| AverageMessageSize | Average size (in bytes) of messages sent |
| LargestMessageSent | Largest message that has been sent (in bytes) |
| LastMessageFailure | Date of the last failure to send a message |
| LastMessageSuccess | Date of the last successful message send operation |
| LastQueueFullEvent | Last time the message queue was full |
| QueueFullEventCount | Number of times the message queue was full |
| QueueUsage | Queue usage as a fraction, 0.0d indicates empty and 1.0d indicates full |
| QueuedMessagesCount | Current count of queued (unsent) messages |
| QueuedMessagesSize | Current size (in bytes) of the queued (unsent) messages |
| TotalMailDataSent | Total size (in bytes) of messages sent |
| TotalMessagesFailed | Total number of messages that failed to send |
| TotalMessagesSent | Total number of messages sent |
診断
Alerts total (com.atlassian.diagnostics:type=Alerts,name=Total)
| 名前 | 説明 |
|---|---|
| LatestAlertTimestamp | Timestamp of the most recent alert |
| TotalCount | Total number of alerts since the JVM was started |
| ErrorCount | Number of alerts of severity ERROR since the JVM was started |
| InfoCount | Number of alerts of severity INFO since the JVM was started |
| WarningCount | Number of alerts of severity WARNING since the JVM was started |
Plugin (com.atlassian.diagnostics:type=Alerts,Category=Plugin,name=${PLUGIN_NAME})
| 名前 | 説明 |
|---|---|
| LatestAlertTimestamp | Timestamp of the most recent alert |
| TotalCount | Total number of alerts since the JVM was started |
| ErrorCount | Number of alerts of severity ERROR since the JVM was started |
| InfoCount | Number of alerts of severity INFO since the JVM was started |
| WarningCount | Number of alerts of severity WARNING since the JVM was started |
| PluginName | Plugin name, if available |
Issue (com.atlassian.diagnostics:type=Alerts,Category=Issue,name=${ISSUE_ID})
| 名前 | 説明 |
|---|---|
| LatestAlertTimestamp | Timestamp of the most recent alert |
| コンポーネント | Component the issue is defined for |
| count | Number of alerts for the issue since the JVM was started |
| 深刻度 | Issue's severity |
| 説明 | Issue's description |
Hosting statistics
| プロトコル | Object name |
|---|---|
| ssh | com.atlassian.bitbucket:name=SshHostingStatistics |
| http | com.atlassian.bitbucket:name=HttpHostingStatistics |
Hosting statistic attributes
All the hosting statistics attributes are monotonically increasing since the JVM was restarted
| 名前 | 説明 |
|---|---|
| CloneCacheBypass | Clone requests that have bypassed the scm-cache |
| CloneCacheHit | Clone requests served from the scm-cache |
| CloneCacheMiss | Clone requests that could not be served from the scm-cache |
| CloneRead | Bytes read from clients during clone operations |
| CloneRequestCount | Number of clone requests served |
| CloneWritten | bytes written to clients during <i>clone</i> operations |
| FetchRead | Bytes read from clients during <i>fetch</i> operations |
| FetchRequestCount | Number of fetch requests served |
| FetchWritten | Bytes written to clients during fetch operations |
| Requests | Total number of requests served |
| TotalBytesRead | Total bytes read from clients |
| TotalBytesWritten | Total bytes written to clients |
Webhooks statistics (com.atlassian.webhooks:name=Webhooks)
| 名前 | 説明 |
|---|---|
| PublishCount | A count of the total number of events that could trigger webhooks (A publish may create many dispatches) |
| DispatchSuccessCount | Total number of webhooks to fire successfully with a successful HTTP response |
| DispatchRejectedCount | A count of the number of webhook dispatches that were rejected for execution |
| DispatchLastRejectedTimestamp | The last time a webhook was rejected, either from circuit breaking, or due to too many webhooks being in flight |
| DispatchInFlightCount | Total number of dispatches that have been triggered and are awaiting resolution |
| DispatchFailureCount | Total number of webhooks that fired successfully, but the HTTP response indicates a failure (non 2xx code) |
| DispatchErrorCount | Total number of webhooks to have had an error while they were being dispatched |
| DispatchCount | Total number of webhooks to have been dispatched |
Thread pools
| Thread pool | 説明 | Object name |
|---|---|---|
| BuildActionsThreadPool | Threads that handles Integrated CI/CD build actions | com.atlassian.bitbucket.thread-pools:name=BuildActionsThreadPool |
| EventThreadPool | Threads that dispatch events to @EventListenermethods | com.atlassian.bitbucket.thread-pools:name=EventThreadPool |
| IoPumpThreadPool | Threads that handle blocking process I/O | com.atlassian.bitbucket.thread-pools:name=IoPumpThreadPool |
| NioPumpThreadPool | Threads that handle nonblocking process I/O | com.atlassian.bitbucket.thread-pools:name=NioPumpThreadPool |
| ScheduledThreadPool | Thread pool that takes care of several miscellaneous scheduled tasks | com.atlassian.bitbucket.thread-pools:name=ScheduledThreadPool |
| Queued | The number of requests currently waiting for an available ticket | N/A |
Thread pool attributes
名前 | 説明 |
|---|---|
| ActiveCount | Returns the approximate number of threads that are actively executing tasks |
| MaximumPoolSize | Returns the maximum allowed number of threads |
| PoolSize | Returns the current number of threads in the pool |
| QueueLength | The number of tasks awaiting execution by the thread pool |
| LargestPoolSize | The largest number of threads that have ever been simultaneously in the pool |
| CompletedTaskCount | The approximate total number of tasks that have completed execution. Because the states of tasks and threads may change dynamically during computation, the returned value is only an approximation, but one that does not ever decrease across successive calls |
Repositories (com.atlassian.bitbucket:name=Repositories)
| 名前 | 説明 |
|---|---|
| count | Number of repositories currently configured across all projects |
Scm Statistics (com.atlassian.bitbucket:name=ScmStatistics)
| 名前 | 説明 |
|---|---|
| Pulls | Number of scm pulls serviced by this instance since it was started |
| Pushes | Number of scm pushes received by this instance is it was started |
Ticket statistics
Starting from Bitbucket 8.0, the Ticket metrics are absent from the com.atlassian.bitbucket property and must be fetched from the Bitbucket Mesh sidecar.
Learn how to enable JMX monitoring for the Mesh sidecar in BSERV-13623 - Getting issue details... STATUS
Bitbucket uses tickets as a mechanism for creating back pressure to prevent the system from being overloaded with requests. There are two types of tickets: hosting tickets and command tickets.
- Hosting tickets (com.atlassian.bitbucket:name=HostingTickets) limit the number of SCM hosting operations, meaning pushes and pulls over HTTP or SSH, which may be running concurrently.
- Command tickets (com.atlassian.bitbucket:name=CommandTickets) limit the number of SCM commands, such as:
git diff,git blame, orgit rev-list, which may be running concurrently.
Bitbucket supports the following metrics for each ticket type.
| 名前 | 説明 |
|---|---|
| Available | The number of tickets available for acquisition (lower number means higher load) |
| 名前 | The name of the ticket bucket either 'scm-command' or 'scm-hosting' |
| 合計 | The maximum number of tickets that can be acquired concurrently before back-pressure is applied |
| Used | The number of tickets that have been acquired (higher number means higher load) |
| LastRejection | The timestamp of the last rejected ticket, or null if no tickets have been rejected. If this metric is missing, follow the public issue BSERV-19088 to stay updated on the fix. |
| OldestQueuedRequest | The timestamp at which the oldest queued request started waiting, or null if there are no queued requests. If this metric is missing, follow the public issue BSERV-19088 to stay updated on the fix. |
Event statistics (com.atlassian.bitbucket:name=EventStatistics)
| 名前 | 説明 |
|---|---|
| DispatchedCount | Total number of listener callbacks that have been performed. An event that is delivered to 10 listeners counts as 10 dispatches |
| LastRejection | Date of the last event being rejected, or null if no event has been rejected |
| PublishedCount | Total number of events delivered. An event that is delivered to 10 listeners counts as 1 event |
| QueueCapacity | Maximum number of event callbacks that can be queued before events are rejected |
| QueueLength | Number of event callbacks that have been queued but haven't been dispatched yet |
| RejectedCount | Total number of events that were not dispatched because the event queue was full |
| RemainingQueueCapacity | Remaining number of event callbacks that can be queued before events are rejected |
Cluster lock statistics (com.atlassian.bitbucket:name=ClusterLocks)
| 名前 | 説明 |
|---|---|
LockedCount | Number of cluster locks that are currently held by this node |
QueuedThreadCount | Number of threads on this node that are currently blocked waiting for a lock |
TotalAcquiredCount | Total number of times a cluster lock was acquired on this node since startup |
TotalAcquireErrorCount | Number of times an exception was thrown while trying to acquire a cluster lock on this node since startup |
TotalAcquireTimeMillis | Total time in milliseconds that any thread on this node has spent acquiring a lock (including time blocked waiting for a lock to become available) |
TotalReleasedCount | Total number of times a cluster lock was released on this node since startup |
TotalReleaseErrorCount | Total number of times an exception was thrown while releasing a cluster lock on this node since startup |
SSH session statistics (com.atlassian.bitbucket:name=SshSessions)
| 名前 | 説明 |
|---|---|
| ActiveSessionCount | Number of currently active SSH session |
| MaxActiveSessionCount | Highest number of concurrently active SSH sessions since the last startup |
| SessionClosedCount | Total number of SSH sessions that have been closed since the last startup |
| SessionCreatedCount | Total number of SSH sessions that have been created since the last startup |
| SessionExceptionCount | Total number of SSH sessions that have been terminated because an exception was thrown from the SSH command run |
| SessionDisconnectedLimitCount | Total number of SSH sessions that have been disconnected due to maximum concurrent requests |
| SessionDisconnectedConnectionLostCount | Total number of SSH sessions that have been disconnected due to connection loss |
Rate limiting statistics (com.atlassian.bitbucket:name=RateLimitStatistics)
| 名前 | 説明 |
|---|---|
| RejectedRequestCount | The number of rate limited requests |
| UserMapSize | The number of token buckets currently in memory |
Third-party library attributes
Bitbucket exposes the JMX attributes from number of third party libraries. Listed below is a sample of the attributes that are particularly interesting from an operations perspective.
HikariCP (com.zaxxer.hikari:type=Pool (bitbucket))
名前 | 説明 |
|---|---|
ActiveConnections | Active Connections (in use) |
IdleConnections | Idle Connection count |
ThreadsAwaitingConnection | The number of threads waiting for a connection (when all available connections are in use) |
| TotalConnections | Total Connections |
Hibernate (org.hibernate.core:sessionFactory=bitbucket.core,serviceRole=org.hibernate.stat.Statistics,serviceType=org.hibernate.stat.internal.ConcurrentStatisticsImpl)
| 名前 | 説明 |
QueryCacheHitCount | Global number of cached queries successfully retrieved from cache |
QueryCacheMissCount | Global number of cached queries not found in cache |
SecondLevelCacheHitCount | Global number of cacheable entities/collections successfully retrieved from the cache |
SecondLevelCacheMissCount | Global number of cacheable entities/collections not found in the cache and loaded from the database |
Expose JMX MBeans within Bitbucket
Starting from Bitbucket 8.0, Git operations are run in the Bitbucket Mesh sidecar by default. That’s why, to enable full JMX monitoring for Bitbucket 8.0 and later, you should enable JMX for both the Bitbucket main process and the Mesh sidecar process.
To enable Bitbucket to publish specific statistics using JMX:
- Locate and open the
bitbucket.propertiesfile in the<Bitbucket home directory>/shareddirectory.Add this property to the file.
jmx.enabled=true- ファイルを保存して閉じます。
- Create a JMX password file for secure access to JMX monitoring.
- Modify the
set-jmx-opts.shfile to enable Bitbucket to expose JMX Mbeans.
These changes will not take effect until Bitbucket is restarted.
Set up the JMX password file
Set up a JMX password file to secure access to JMX monitoring.
Create a file named
jmx.access.This file will contain password information. Ensure the file is only readable by the secure user Bitbucket will run under. However, note that if the user cannot read the file Bitbucket will fail to start.
Edit the
jmx.accessfile to include this property and save the file.monitorRole <password>If you wish to use a username other than
monitorRoleorcontrolRoleyou will need to modify the jmxremote.access file located in the /lib/management/directory of the installed Java.Change ownership of
jmx.accessfile,chown bitbucket:bitbucket <path>/jmx.accesswhere
bitbucketis the user that runs Bitbucket service.Change file permissions of
jmx.accessfile.chmod 600 <path>/jmx.access
Modify the Bitbucket environment file
Modify the set-jmx-opts.sh files to enable JMX monitoring:
Within the
bindirectory, locate the fileset-jmx-opts.shand change these properties.JMX_REMOTE_AUTH=password JMX_REMOTE_PORT=3333 RMI_SERVER_HOSTNAME=-Djava.rmi.server.hostname=<hostname> JMX_PASSWORD_FILE=<path>/jmx.access- Restart Bitbucket.
Docker
For Docker deployments, the properties can be passed as Docker environment variables:
Sample:
docker run -v /data/bitbucket:/var/atlassian/application-data/bitbucket \
  --name="bitbucket" \
  -d -p 7990:7990 -p 7999:7999 -p 3333:3333 \
  -e JMX_ENABLED=true \
  -e JMX_REMOTE_AUTH=password \
  -e JMX_REMOTE_PORT=3333 \
  -e JMX_REMOTE_RMI_PORT=3333 \
  -e RMI_SERVER_HOSTNAME=<hostname> \
  -e JMX_PASSWORD_FILE=<path>/jmx.access \
  atlassian/bitbucket
Verify JMX is configured correctly
These steps use JConsole to test that JMX has been configured correctly. JConsole is a utility that ships with the Oracle JDK.
To start the jconsole utility, from a command line prompt enter
jconsole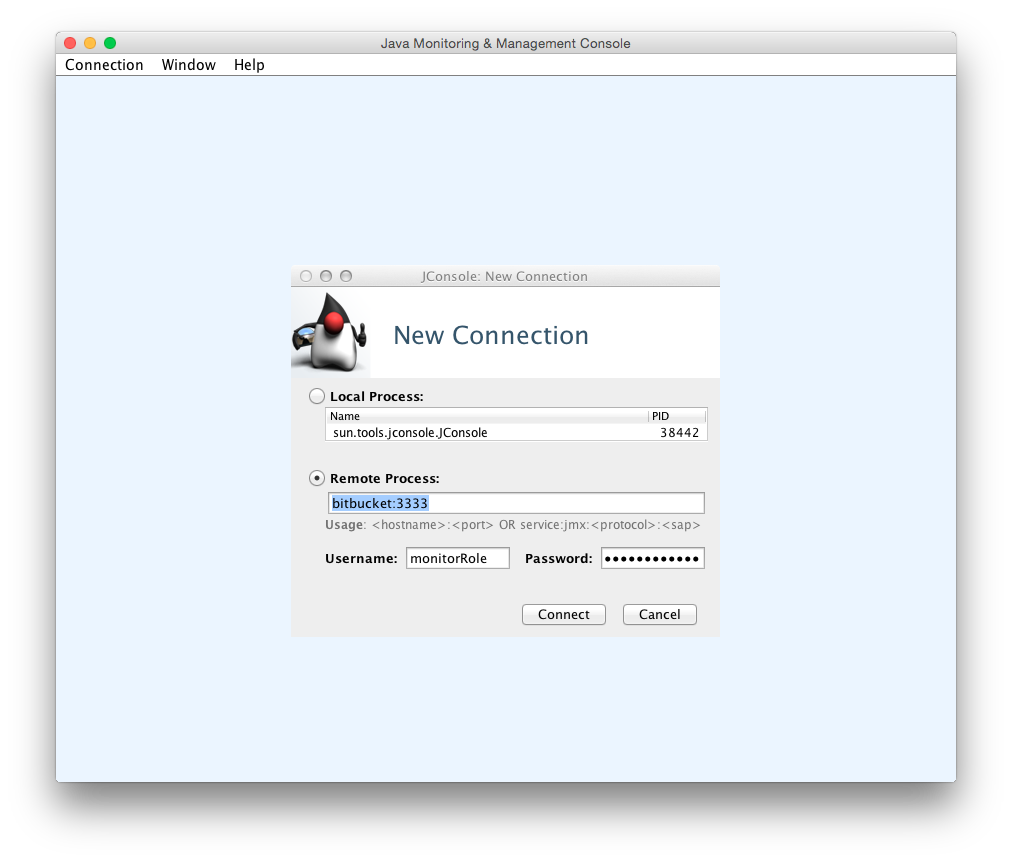
Create a new JConsole connection with similar connection settings.
bitbucket the hostname of the instance to monitor 3333
the JMX port number previously configured.
username, password values configured within the JMX password file jmx.access.接続 をクリックします。
When configured correctly, you will see the following properties.
com.atlassian.bitbucket Starting from Bitbucket 8.0, the Ticket metrics are absent from the Learn how to enable JMX monitoring for the Mesh sidecar in BSERV-13623 - Getting issue details... STATUS |
|
| com.atlassian.bitbucket.thread-pools |
|
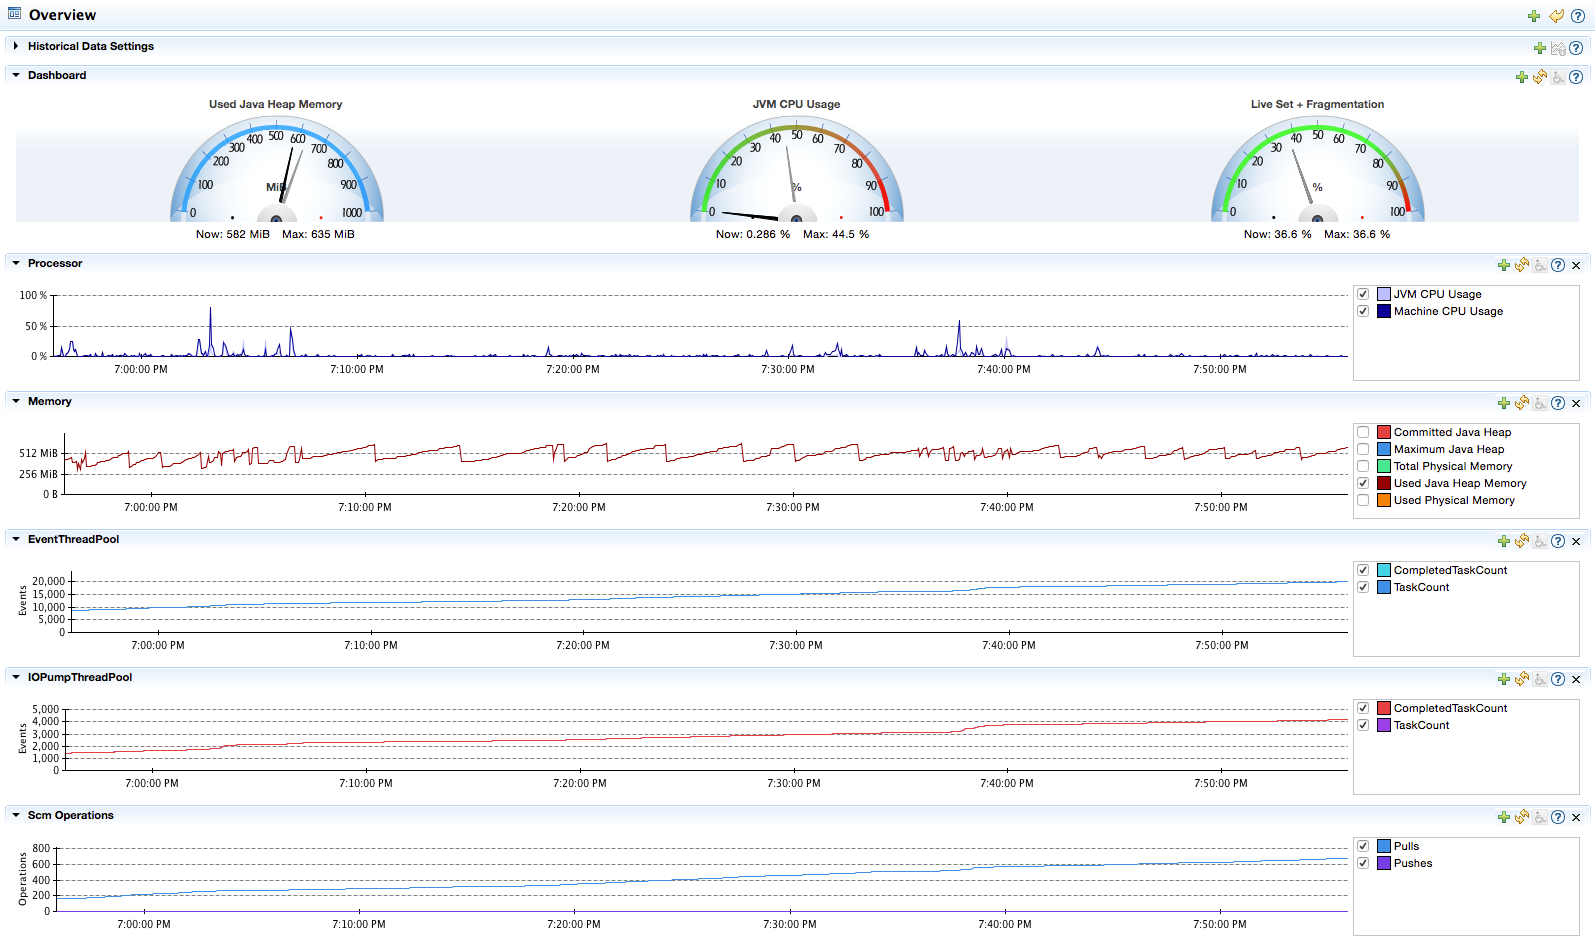
Example performance dashboard
This dashboard was generated using Java Mission Control that ships with the Oracle JDK (since 1.7u40). See the documentation that comes with your JMX client of choice for more information.
Configuring JMX to use SSL
You can find information about the options for configuring JMX to use SSL in the set-jmx-opts files. Comprehensive documentation is available from Oracle.
製品内診断メトリック
次のセクションを展開して、製品内診断で利用できるメトリックの詳細を学習してください。
To use these metrics, make sure you've first enabled JMX.
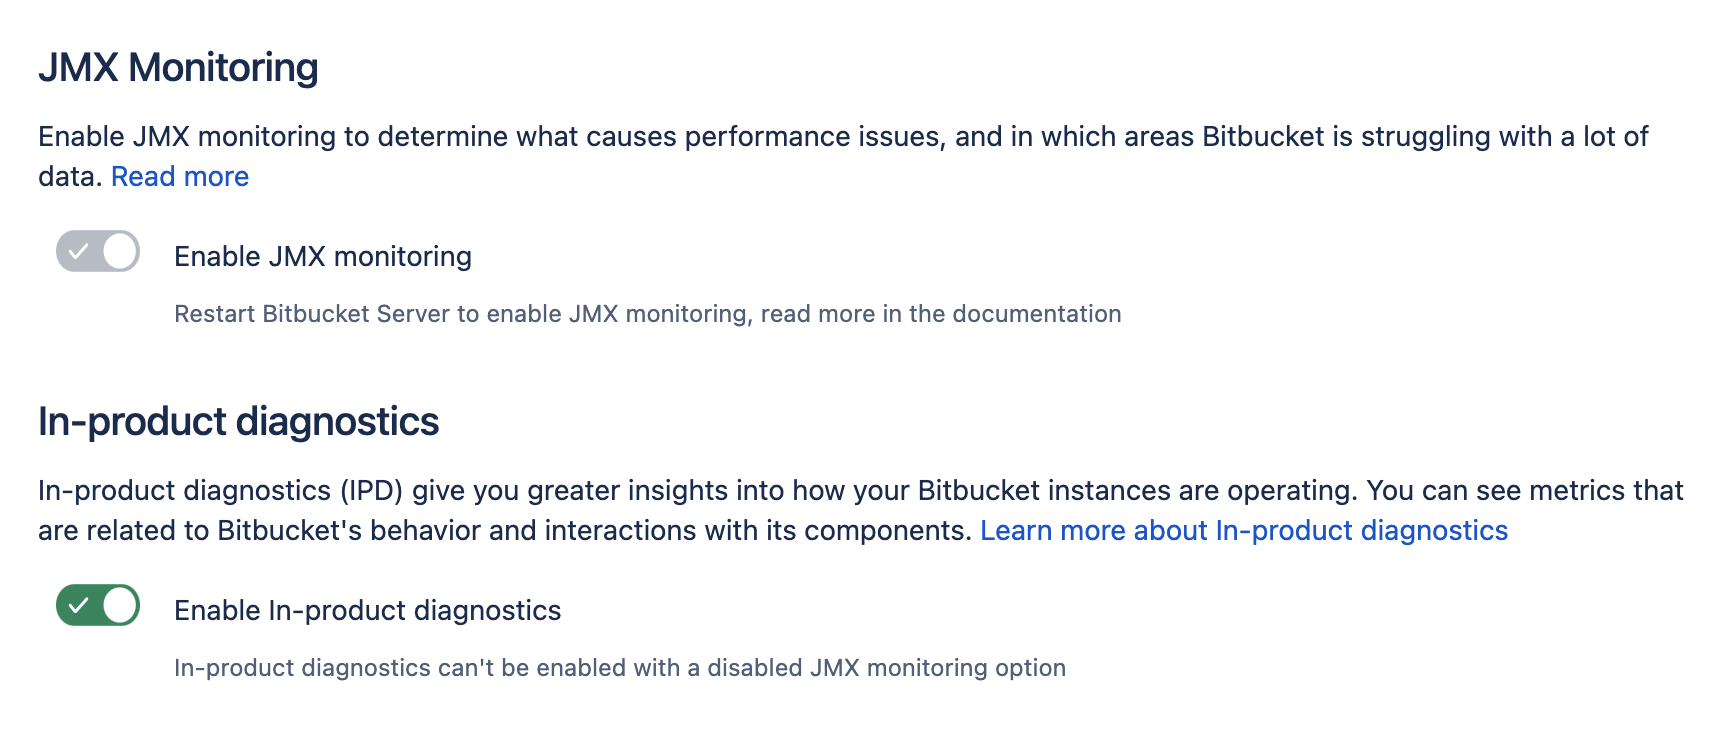
製品内診断モニタリングを有効にする
In-product monitoring is enabled by default.
JMX ログ記録のポーリング間隔は 60 秒に設定されており、変更できません。
To manage it:
- Go to Administration > General configuration > Monitoring.
- Use the Enable in-product diagnostics toggle to enable or disable in-product monitoring.
ログ形式
Writing to atlassian-bitbucket-ipd-monitoring.log is done via log4j. Its configuration is managed in logback-spring.xml.
ログの内容
By default, a concise set of data is included in each log entry. An extended set of data can be logged by enabling the bitbucket.in.product.diagnostics.extended.logging dark feature flag.
Learn how to enable the dark feature flag
次の各表で、簡潔ログ形式と拡張ログ形式の構造をご確認ください。
The metrics in JMX always go in the extended data format
簡潔データ
| MBean タイプ | Properties | 属性 |
|---|---|---|
| カウンター | timestamp ラベル 属性 | _count |
| 値 | _value | |
| 統計 | _99thPercentile _max _min _mean |
拡張データ
The metrics in JMX always go in the extended data format. Learn more about the metric attributes
| MBean タイプ | Properties | 属性 |
|---|---|---|
| カウンター | timestamp ラベル 属性 オブジェクト名 | _count _fifteenMinuteRate _fiveMinuteRate _meanRate _oneMinuteRate _rateUnit |
| 値 | _value _number | |
| 統計 | _50thPercentile _75thPercentile _95thPercentile _98thPercentile _99thPercentile _999thPercentile _count _min _max _mean _stdDev _durationUnit _fifteenMinuteRate _fiveMinuteRate _meanRate _oneMinuteRate _rateUnit |
指標属性の定義
指標属性の詳細は、次のセクションを展開してご確認ください。