Review Coverage report
Crucible has useful reports that show you detailed statistics on review activity. The Review Coverage report allows you to see how much of the code, and which files, in your repository have been reviewed, and when. You can also access the reviews.
![]() This feature requires Fisheye integrated with Crucible.
This feature requires Fisheye integrated with Crucible.
On this page:
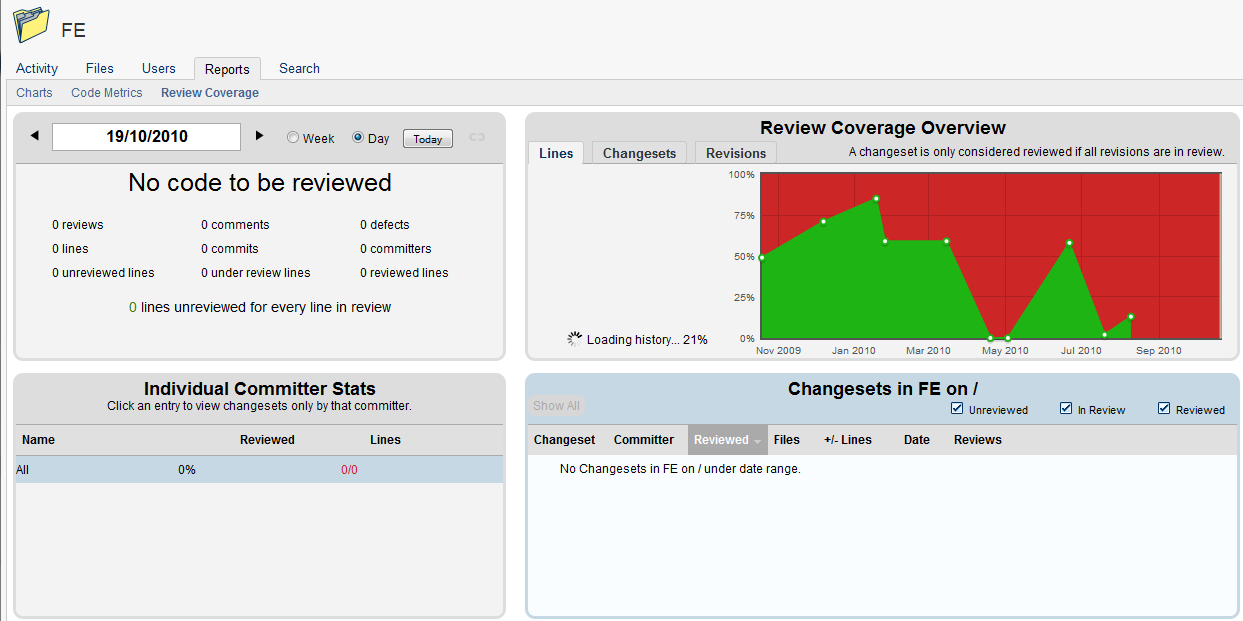
Screenshot: The Review Coverage report
Opening the Review Coverage report
To open the Review Coverage report:
- Click Repositories and choose a repository. The repository you chose sets the scope for the report.
- If desired, navigate down the tree (in the lefthand panel) and click the desired path you want to view coverage on.
- Click Reports in the secondary toolbar.
- Click Review Coverage from the list of reports in the upper panel.
![]() You can view coverage of any path by navigating down the tree to the desired path you want to view coverage on, before clicking on the Reports tab.
You can view coverage of any path by navigating down the tree to the desired path you want to view coverage on, before clicking on the Reports tab.
Using the Summary Panel
The summary panel displays the following metrics for your selected repository:
- Overall review coverage percentage.
- Change in review coverage percentage since the last reporting period.
- Total number of reviews.
- Total number of comments.
- Total number of reported defects.
- Total number of Lines of Code (LOC).
- Total number of commits.
- Total number of committers.
- Total number of unreviewed lines.
- Total number of lines under review.
- Total number of reviewed lines.
- A ratio of the number of lines unreviewed against reviewed Lines of Code (LOC).
Screenshot: Summary Panel in the Review Coverage report

Note: Code coverage metrics only apply for post-commit reviews.
Using the Review Coverage Overview
The Review Coverage Overview shows a timeline of reviews, compared against their percentage of coverage. Hover your mouse cursor over the data points on the graph to see granular information and click through to a detailed weekly report.
You can click the tabs to view the coverage expressed as a percentage of lines of code, changesets or revisions.
Screenshot: Overview Panel in the Review Coverage report

Using the Individual Committer Stats panel
The Individual Committer Stats panel lets you choose a user from your Crucible instance and see all the changesets by that committer.
Screenshot: Individual Committer Statistics in the Review Coverage report

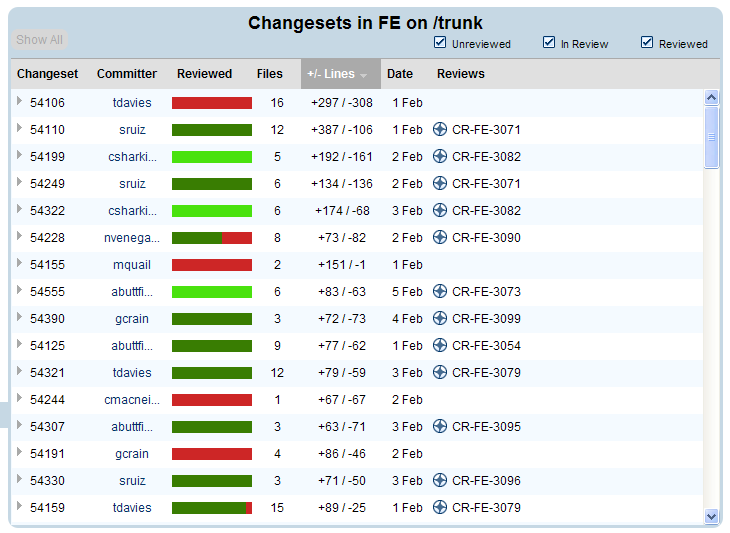
Using the Changesets panel
The Changesets panel lets you see changesets from your Crucible instance (for the time period of the report), and their level of review coverage. This information can be sorted by the columns in this view and uses color coding to denote review coverage (listed in the table below).
Color Key
色 | 状態 |
|---|---|
dark green | reviewed |
light green | in review |
赤 | not reviewed |
Screenshot: Changesets panel in the Review Coverage report