Jira Cloud Migration Assistant を利用してご利用のインスタンスの規模を評価する: データベース クエリと利用状況のメトリクス
You can assess the cloud readiness of your Jira Data Center instance by collecting data about its content, such as the number of users, projects, custom fields, and many more.
動作の仕組み
The cloud readiness of your Data Center instance will be assessed by comparing your data with Atlassian guardrails relevant for migrations or your future setup in cloud.
How you’ll collect, share, and view your data can be done in one of the following ways:
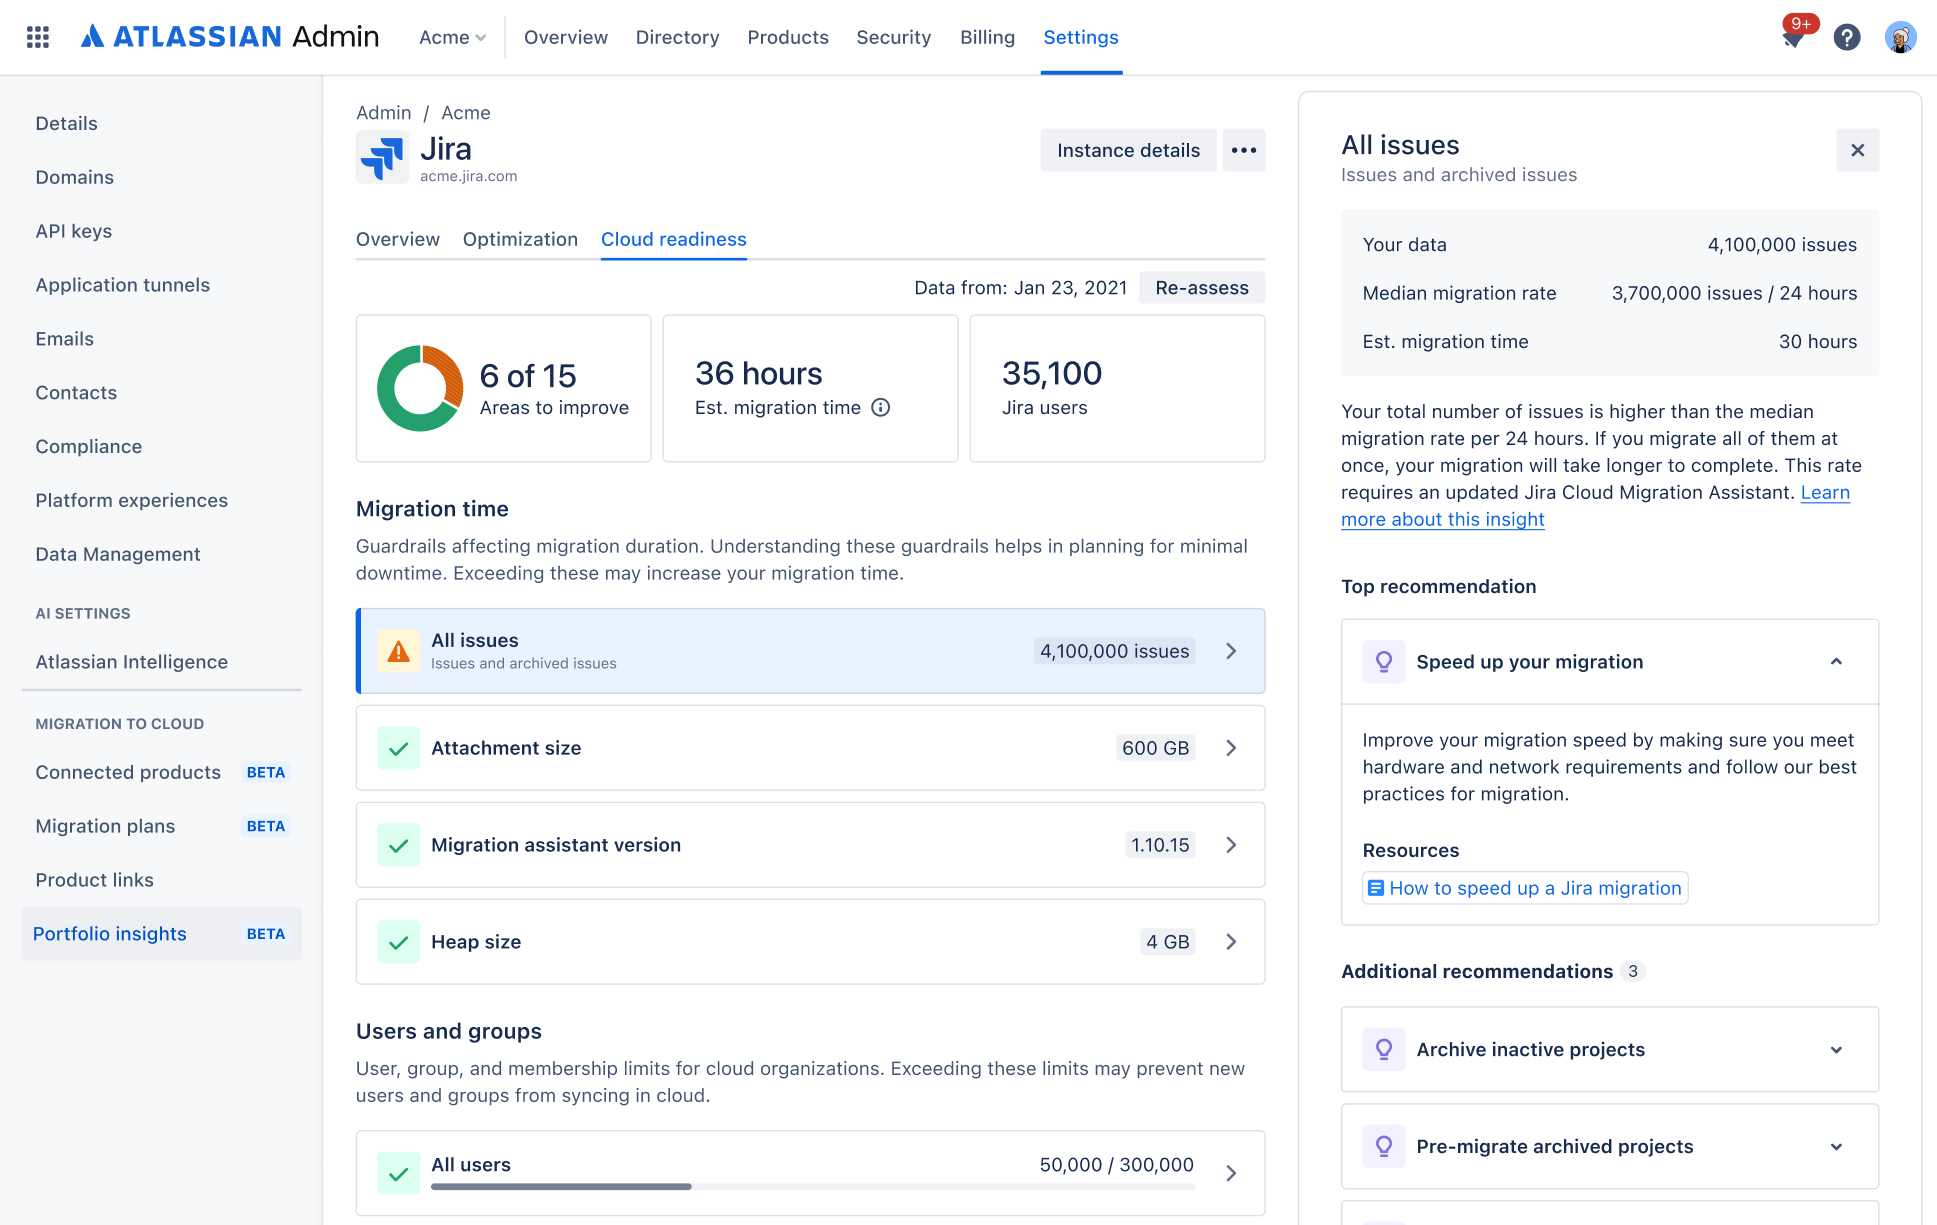
OPTION 1 Using Portfolio insights RECOMMENDED
You’ll use Portfolio insights to connect to Data Center and collect the data (with a fallback manual collection possible). Your cloud readiness report will be generated instantly.
Your raw data will be available to Atlassian migration teams who can provide additional information, if needed.
OPTION 2 Sharing raw data with Atlassian
You’ll run the assessment from the migration assistant and attach results to your MOVE ticket. Migration teams will prepare a cloud readiness report and share it with you. Use this option only when recommended by Atlassian migration teams.
![]() Use for Atlassian Government Cloud migrations.
Use for Atlassian Government Cloud migrations.
![]()
収集されるデータ
In both options, the report is prepared based on the data collected through the migration assistant. Here’s a summary of what we collect:
Jira entities: Number, or metadata, of entities, such as projects or issues
Usage data: for example the number of active users in the past days
Instance metadata: products installed, details about the database, Data Center nodes, and some metadata related to your instance, such as Server ID or timezone
Browser metrics: performance and browser metrics, including network speed and quality, based on users' browser
Apps: number and size of entities that might affect the migration, for the most critical apps
Once collected, the data is saved in a ZIP archive and either transferred or uploaded to Portfolio insights or attached by you to your MOVE migration ticket.
For more details, see What data is collected
Not all collected data is analyzed and used in your report.
当社でのデータの利用について
We’ll only collect and use the metadata about your Jira instance. This metadata doesn’t contain any Personally Identifiable Information (PII) or user-generated content (UGC). It’s based only on IDs.
これにより、当社ではお客様のデータの複雑さとクラウド製品におけるパフォーマンス要件をよりよく理解し、お客様のリスクを軽減して成功へと導く移行戦略や計画を立てることができます。さらに、収集されたメタデータは、当社の製品やツールを継続的に改善するのに役立ちます。
FAQ
Here are some common questions.
はじめる前に
前提条件は次のとおりです。
We add new data points on a regular basis. To get the most accurate results, update Jira Cloud Migration Assistant to the latest version.
The assessment duration depends on your data. On average it takes up to a few hours, but should be much faster for less complex instances.
OPTION 1
Using Portfolio insights RECOMMENDED
In this option, you’ll connect to your Data Center instance from Portfolio insights to collect the results, and then view your cloud readiness report.
1. Go to Portfolio insights
You can access Portfolio insights by going to admin.atlassian.com, and selecting Settings > Portfolio insights. Check the following page for detailed instructions.
2. Connect to your Data Center instance
To connect to a Data Center instance, you’ll need to meet some requirements like installing the Cloud Companion app and allowlisting the https://api.atlassian.com domain.
How to connect to Data Center instances
3. (Fallback) Manually collect and upload data
If you’re unable to connect to your Data Center instance, you can manually run the assessment and upload the results to Portfolio insights.
How to manually collect and upload data
4. View your cloud readiness report
Once the data is collected and transferred/uploaded to Portfolio insights, you’ll be able to view your cloud readiness report, with insights into your data and recommendations on how to fix or improve it.
How to view your cloud readiness report
OPTION 2
Sharing raw data with Atlassian
In this option, you’ll manually run the assessment from the migration assistant. When it’s ready, you’ll download a ZIP archive and share it with Atlassian by attaching it to your MOVE ticket.
収集されるデータ
Details of files included in the ZIP archive and examples of collected data points.
ファイル | 説明 |
|---|---|
| データベースから取得された、特定のエンティティに関するデータ。ご利用のインスタンスの規模を当社で理解するのに役立ちます。 |
| アクセス ログから取得された、使用状況のメトリクス。Jira Cloud チームがお客様に最適なクラウド インスタンスを判断するのに役立ちます。 |
| Details about your instance, including products, infrastructure, database, Data Center nodes, and some metadata for easier identification. |
| インスタンスのパフォーマンスに関する、ユーザーのブラウザから取得されたデータ。これは、クラウドで最高のパフォーマンスを実現するために必要な要素を当社で理解するのに役立ちます。 |
| Data about entities that might affect the migration, for the most critical apps. If you have these apps, each will have a separate file inside. |
| (非推奨) このファイルには、 |
Details of metrics included in the files
More details about the data points and metrics included in the files.
ファイル: jira-entities-[date].csv
このファイルには次のメトリクスが含まれます。
File: jira-usage-metrics-[date].csv
Interactions date: Jira インスタンスの操作がアクセス ログに記録された日付。
Active users per day: 過去 14 日間に Jira インスタンスを操作した一意のユーザーの数。
Peak-hour active users per day: Jira インスタンスを同時に操作した一意のユーザーの数。ユーザー ID と、それに対応する日付と時間の組み合わせとをアクセス ログに集約することで取得しています。インスタンスのもっとも忙しい時期のスナップショットを提供します。
Node availability and data collection status: 各ノード (または単一ノード) の可用性のデータ。データ収集の状況も示されます。
ファイル: jira-instance-metadata-[date].jsonl
Products: Name, version, and SEN number of products installed on your instance.
- Infrastructure: Details about the database, Data Center nodes, and Java heap size.
- Instance metadata: Some metadata, including assistant version, Server ID, instance UUID, and timezone.
ファイル: jira-browser-metrics-[date].jsonl
user ID: ユーザーの一意の識別子。プライバシーを守りつつ、弊社側でユーザーとのやりとりを追跡できるようにするために、安全に生成され、ランダムにハッシュ化されます。
Browser type and version: ブラウザの詳細。Google Chrome、Safari など。
Operating system: オペレーティング システムの詳細。Windows、MacOS など。
Processor count: デバイス上のプロセッサの数。
System memory (RAM): デバイス上のメモリまたは RAM の総容量。
Network download speed: データのダウンロード速度。
Network connection quality: ネットワーク接続の有効性。
Network Latency (RTT): ラウンド トリップ時間 (RTT) は、信号がユーザーのコンピューターから Jira インスタンスに伝わり、戻ってくるまでにかかる時間の測定値です。これは、ユーザーのネットワーク接続の応答性を測定するのに役立ちます。
ファイル: cloud-scale-database-[date].csv
このファイルは廃止されており、今後のバージョンのいずれかで削除される予定です。これには、jira-entities-[date].csv ファイルにも含まれているエンティティに関するデータが含まれています。
Apps subdirectory
This subdirectory contains files with entities for the most critical apps.
File: user-installed-apps-[date].jsonl
ファイル: zephyr-squad-[date].jsonl
ファイル: xray-[date].jsonl
ファイル: scriptrunner-for-jira-[date].jsonl
ファイル: jira-misc-custom-fields-[date].jsonl
ファイル: jsu-automation-suite-[date].jsonl