プロジェクトの統計を参照する
This page explains the layout of the Project Summary page.
On this page:
When you click through to a Crucible Project from the Projects Tab, the 'Project Summary' screen opens.
Screenshot: The Crucible Project Summary Page
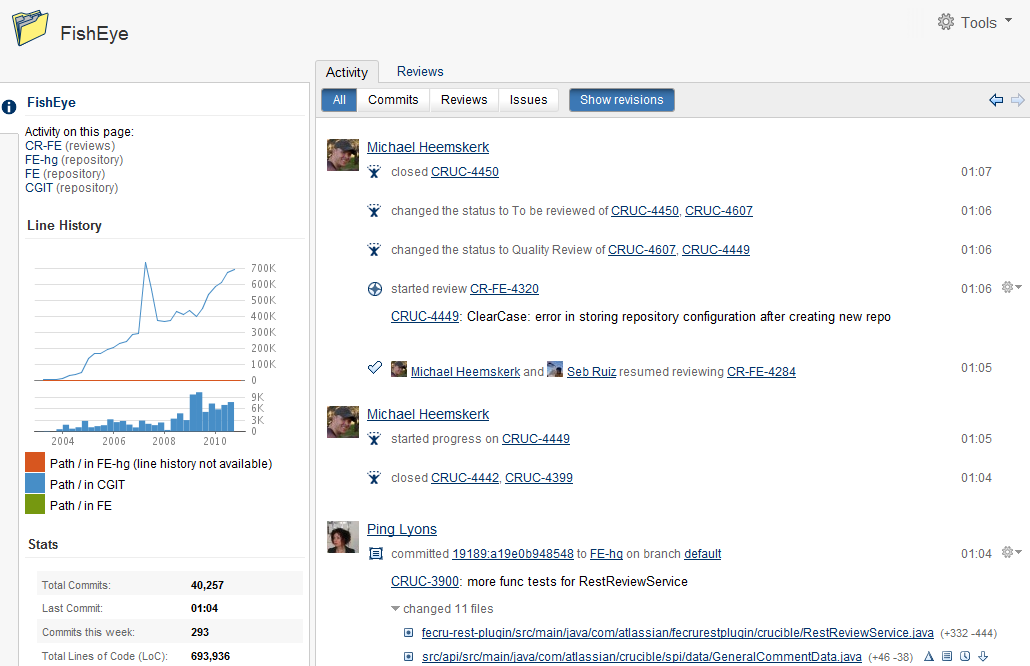
In the right hand pane, you can see an activity stream relating to this project. In the left hand pane, you can see various statistics charts relating to the project in context. These appear in a reduced size until you click them, when they will expand to show more information.
Project Name Panel
This contains a short message explaining which Crucible Project and Fisheye repositories are being accessed to show the activity stream on the page.
Project Line History Panel
This panel contains a chart showing the lines of code added to the repository, graphed over time.
Screenshot: The Project Line History Panel

Project Stats Panel
This panel contains a chart showing numerical data for commits, files changed and lines change, graphed over time.
Screenshot: The Project Stats Panel

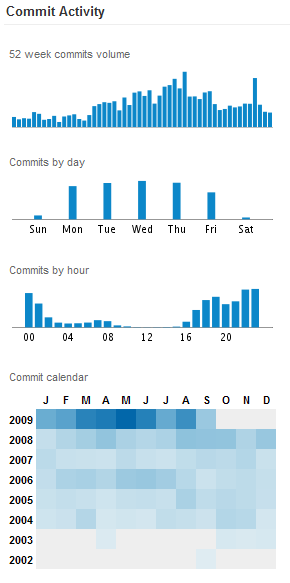
Project Commit Activity Chart
This panel contains a number of charts:
チャート | 説明 |
|---|---|
| 52 week commits volume |