Automation Rules aren't running for a period of time in Jira
プラットフォームについて: Data Center - この記事は、Data Center プラットフォームのアトラシアン製品に適用されます。
このナレッジベース記事は製品の Data Center バージョン用に作成されています。Data Center 固有ではない機能の Data Center ナレッジベースは、製品のサーバー バージョンでも動作する可能性はありますが、テストは行われていません。サーバー*製品のサポートは 2024 年 2 月 15 日に終了しました。サーバー製品を利用している場合は、アトラシアンのサーバー製品のサポート終了のお知らせページにて移行オプションをご確認ください。
*Fisheye および Crucible は除く
要約
Automation Rules don't run for a time period, then they all run after a certain time as if something was blocking them.
環境
Any Data Center version of Jira Software or Jira Service Management.
診断
Automation Rules aren't executed for a period of time, then they all start being processed as if something was blocking them.
Performance Insight graph
On the Performance Insights page (View performance insights for automation rules), we'll see almost no rules being executed for some time then a spike on executions after some time:

Automation queue (database table)
The queue table will report many records during the period that rules aren't running:
SELECT COUNT(*) FROM "AO_589059_AUTOMATION_QUEUE";(you may need to remove the double-quotes depending on your database)
If we schedule this select count(*) to run every few minutes continuously, we may see a considerable increase on the queue size at certain point, the queue building up and eventually being processed.
スレッド ダンプ
Thread dumps can be captured and they may report as running the whole time, apparently executing some rules:
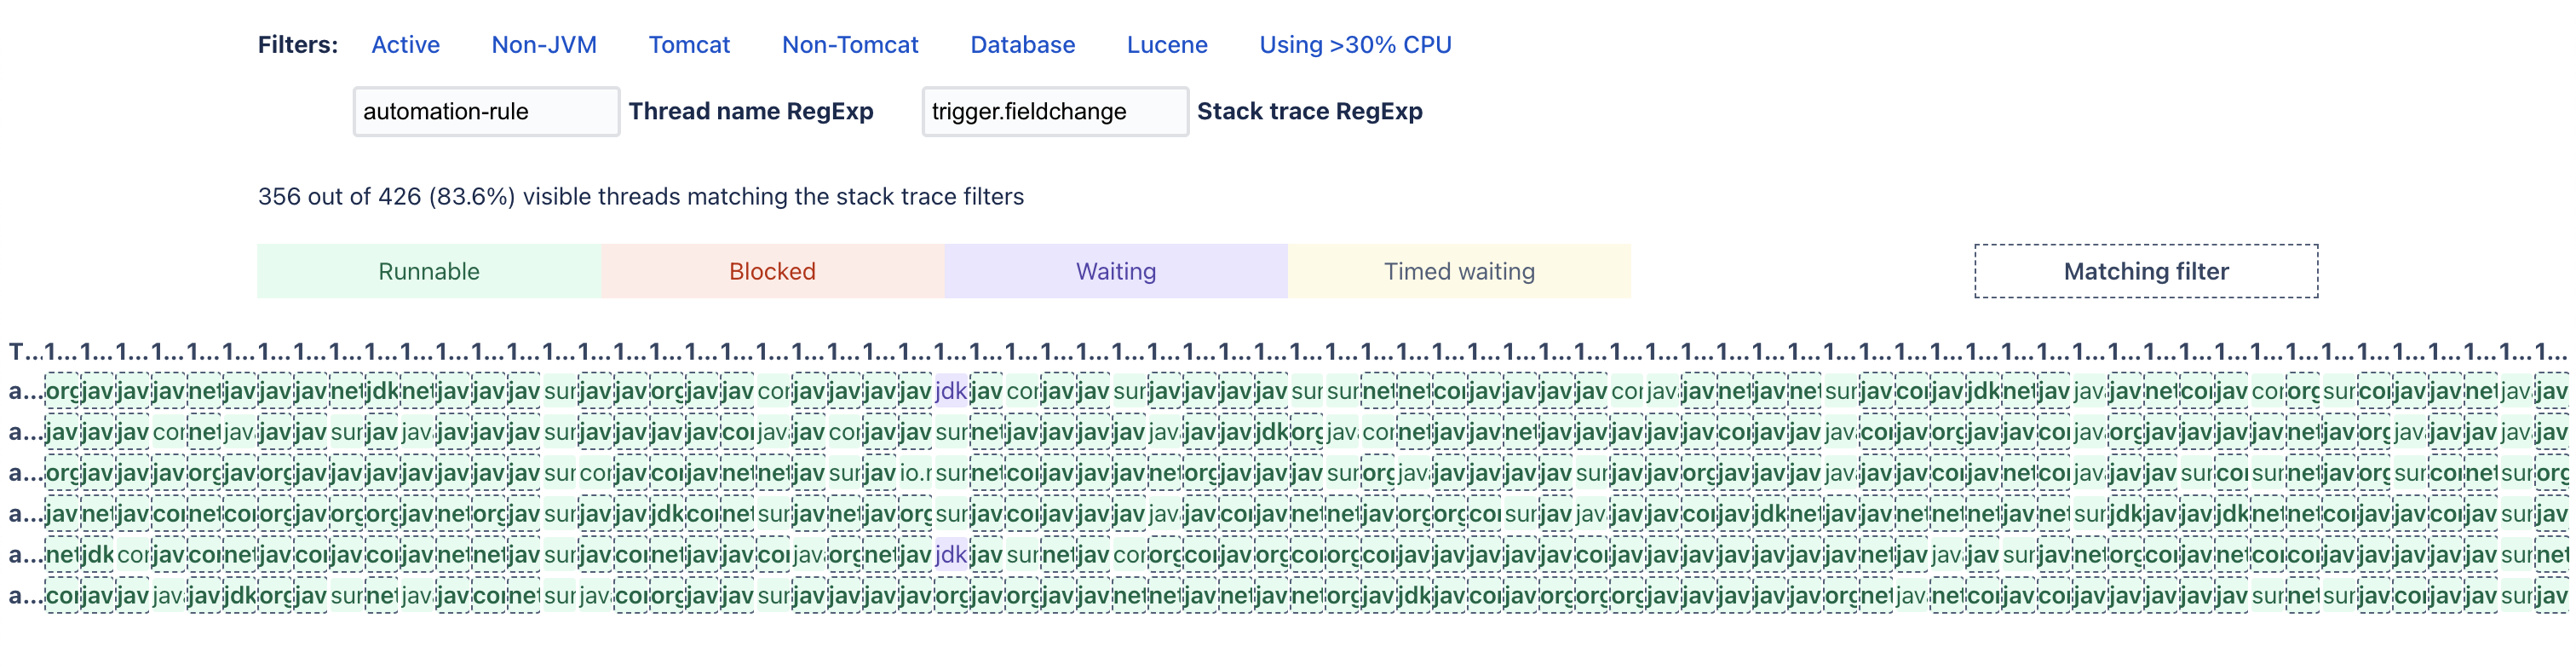
In this example, the 6 automation-rule-executor Threads are processing rules coming from the "Field Value Changed" trigger.
原因
There can be a number of different causes for this, from sheer flood of events (triggered by jobs or abnormal end-user activity), 3rd party apps behavior or Assets imports with ScriptRunner installed.
During a time of high queue count, we can run this select on the DB to find out what's populating the queue:
select "PAYLOAD" from "AO_589059_AUTOMATION_QUEUE" order by "ID" asc;We're interested on grouping the "triggerType" of most of the Rules in the queue. This here's just an example command to achieve this in Linux, with the output above as "output.csv":
cat output.csv | grep -E -o '""triggerType"":""[A-Za-z0-9\-_]*""' | sort | uniq -c | sort -nrIt may output something like this, indicating in this example the flood of events was caused by a third party (App) trigger:
31257 THIRD_PARTY_EVENT
 5985 EVENT
 5517 POLLED
   35 SCHEDULED
ScriptRunner Trigger on Assets updates
If you have all these criteria, you may be affected by SRJIRA-7291 (Dynamically register asset triggers when used):
- A high count of THIRD_PARTY_EVENT on the previous query (from AO_589059_AUTOMATION_QUEUE)
- ScriptRunner enabled
- Assets (Insight) with scheduled imports, or if an import or massive create/update action has happened before or during the queue build-up
You can confirm it with the same "output.csv" from before:
grep "com.onresolve.jira.groovy.groovyrunner:object-bean-created-trigger" output.csv -cIf the count's close to the count of THIRD_PARTY_EVENT before, most of the triggers are from ScriptRunner. This is because this app provides two triggers (enabled by default) that fire once ay Object in Assets is created or updated — regardless if there's any Automation Rule using it.
ソリューション
The actions on the Cause section should give a good idea as to where the flood is coming from. Trace the "triggerType / type" values from AO_589059_AUTOMATION_QUEUE to see what's triggering so many rules and work on the root cause.
Increasing the Automation rule executor thread pool
If the load's not erratic, you may have to increase the Automation executor pool size — though this is hardly the case. Please consider reaching out to Atlassian Support to confirm this approach as doing this needlessly may have drawbacks as increased CPU load or other contention.
To change the Automation executor pool (default of 6 Threads), an admin can make a REST API request like this curl example:
curl -H "Authorization: Bearer PAT-GOES-HERE" -X PUT -H "Content-type: application/json" -d '{"key": "automation.processing.thread.pool.size.per.node", "value": "6"}' https://Jira-base-URL/rest/cb-automation/latest/configuration/propertyChange accordingly:
- PAT-GOES-GERE by an admin's PAT (Using Personal Access Tokens)
- "6" by the desired Thread pool size (default's 6)
- Jira-base-URL by the Jira URL
If you increase this Thread pool temporarily, either for troubleshooting purposes or as an emergency quick fix, be sure to decrease it back to the default after the root cause's been addressed.
ScriptRunner triggers
If you identified the majority of the triggers coming from ScriptRunner, you can either:
- Avoid having so many Assets Objects created or updated at once (breakdown and spread the import if the update's really necessary)
- Disable two ScriptRunner modules if you're not making use of them:
- Trigger on object bean creation (object-bean-created-trigger)
- Trigger on object bean update (object-bean-updated-trigger)