Reporting in Jira
はじめに
Reporting is one part of ensuring your projects' success and smooth operations in Jira. It involves gaining knowledge about your JIRA projects' health, progress and overall status through Gadgets, report pages, or even third-party applications. This guide provides an overview of the tools available to Jira users today and how they can be used to fulfill the different types of reporting needs that users face today.
Please note that this is a live document, and the best practices are not set in stone. Please feel free to contribute with comments and share your best practices around reporting!
In this guide:
Tools for Reporting
Let us start with the out-of-the-box tools available, pre-installed and available through Atlassian Marketplace. We will look at each tool from a technical perspective and, in the next chapter, see how they can be applied to the different types of reporting.
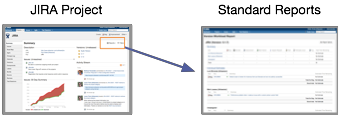
Standard Reporting
Jira offers reporting in several different formats. Project reports are available from the selected project's home screen, and Gadgets can be added and arranged in Dashboards. For each filter, the issue navigator offers various output formats for third-party reporting software. We will also mention some advanced methods that customers have been using.
標準レポート
In Jira, a project automatically offers standard reports that are available to the user without any necessary configuration. These standard reports comprise a wide range of reporting applications, such as time tracking and workload, and abstract reports like Pie Charts that can be used in various ways.
| Standard Report | 説明 |
| 平均日数レポート | Shows the average age (in days) of unresolved issues. |
| 作成済み課題 vs 解決済み課題レポート | Shows the number of issues created vs number of issues resolved over a given period of time. |
| 円グラフレポート | Shows the search results from a specified issue filter (or project) in a pie-chart, based on a statistic of your choice. |
| 最近作成された課題レポート | Shows the rate at which issues are being created. |
| 解決時間レポート | Shows the average time taken to resolve issues. |
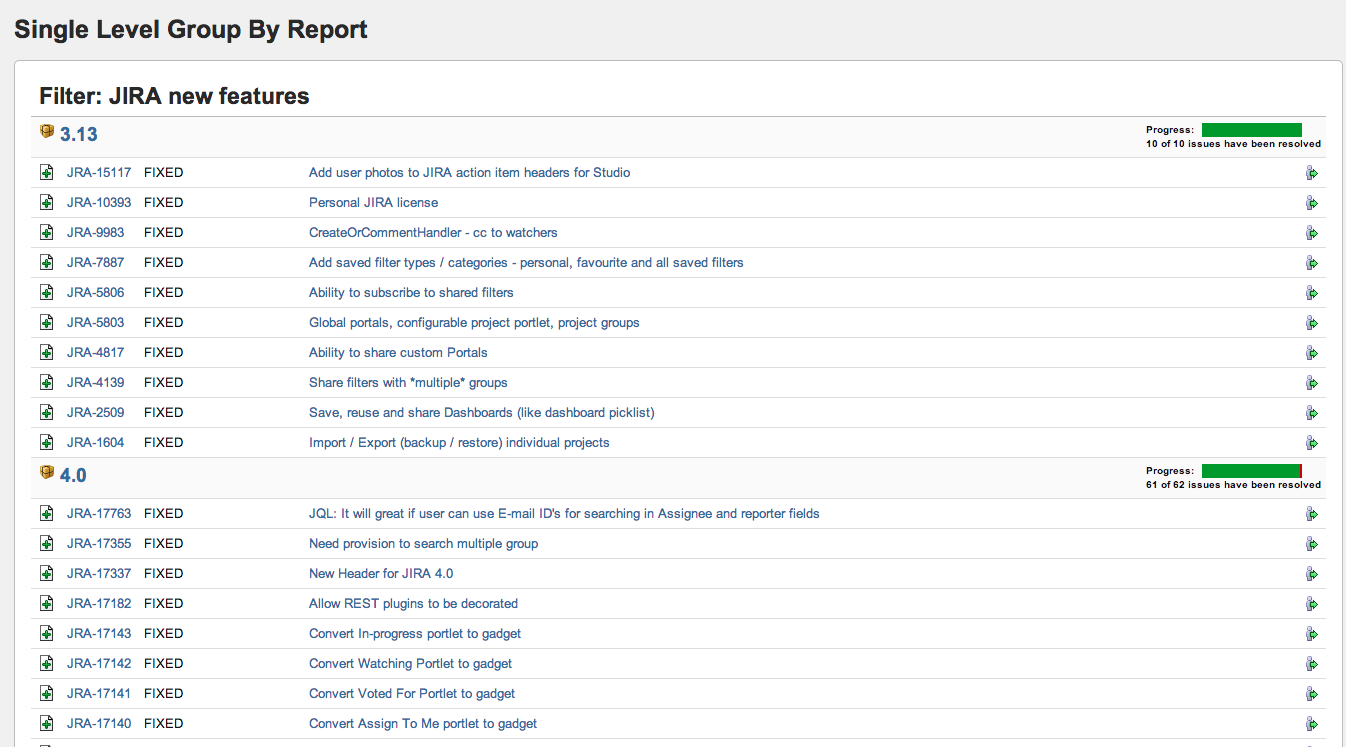
| 単一レベル グループレポート | Shows the search results from an issue filter, grouped by a field of your choice. |
| 課題の経過時間レポート | Shows the number of issues for which your chosen date field (e.g. 'Created') was set on a given date. |
| ユーザー ワークロード レポート | ユーザーが割り振られた作業量と、その所要時間を示します。 |
| Version Time Tracking Report | Shows progress towards completing a given version, based on issues' work logs and time estimates. |
| バージョンワークロードレポート | 特定バージョンが完了ために処理する作業がどのくらい残っているかをユーザー別および課題別に示します。 |
| ワークロード円グラフ レポート | Displays the relative workload for assignees of all issues in a particular project or issue filter. |
| 時間管理レポート | If Time tracking is enabled: Displays useful time tracking information on issues for a particular version of a project. |
Custom Gadgets and Dashboards

Filter and Gadgets
The basis of almost any custom reporting is the Issue Navigator that enables you to slice and dice the data in JIRA in almost any way imaginable. The queries in the Issue Navigator can be created by using either a simple search or a JQL statement in the advanced search. Most important for reporting is that the searches can be saved as filters which can be shared to an individual user, group, the entire organization and with a reporting Gadget. This allows a plug-and-play configuration of reporting gadgets with Filters created by the user itself or those shared with her/him. Issues resulting from filters are displayed in the Browser but can also be exported using various formats like Excel, XML, etc.
Trends and historic searches
Worth mentioning is the capability of JQL to not only search for issues that fulfill criteria in the current time but also identify issues based on historic occurrences and trends. Operators like "changed", "after", "before" and "during" enable to combine criteria on past statuses with present criteria, e.g. for the identification of issues whose priority has been changed or components whose issues have been spilled over to the next version. For more information, see the JQL Reference.
Dashboards
Gadgets are added and arranged in a JIRA Dashboard. Being the first visible screen after entering JIRA, the Dashboard enjoys great visibility and has become the primary place in the system to view reports of JIRA data and connected systems. The Dashboard lends itself very well to reporting with its support of customized layout, multiple Dashboard pages and ability to change the look and behavior of each Gadget. Furthermore, Dashboard pages can be shared with a user, group or the entire organization. This makes Dashboards the perfect tool to create and share Report pages dedicated to specific projects and types of reporting.
Please see a list of currently pre-installed JIRA Gadgets below. There are also a large number of other Gadgets available that retrieve data from other Atlassian systems. Please see the big list of all Atlassian Gadgets for more information. Now, the JIRA Gadgets:
| Reporting Gadget for JIRA Data | 説明 |
| アクティビティ ストリーム | The Activity Stream Gadget displays a summary of your recent activity. |
| Administration | The Administration Gadget displays quick links to administrative functions. |
| 自分の担当課題 | The Assigned To Me Gadget displays all open issues in all projects assigned to the current user viewing the dashboard. |
| Average Age | The Average Age Gadget displays a bar chart showing the average number of days that issues have been unresolved. |
| Bugzilla ID Search | The Bugzilla ID Search Gadget allows the user to search all JIRA issues for references to Bugzilla IDs. |
| カレンダー | Displays issues and versions in calendar format, based on due date. |
| Created versus Resolved Issues | Displays a list of all the issue filters that you have marked as favourite. |
| Favourite Filters | The Favourite Filters Gadget displays a list of all the issue filters that have currently been added by you as a favourite filter. |
| フィルター結果 | The Filter Results Gadget displays the results of a specified issue filter. |
| ヒート マップ | Displays the relative weighting of the values in a given field, for issues returned from a given project or filter. |
| 進行中の課題 | Displays all issues that the current user is working on. |
| はじめに | The Introduction Gadget displays a configurable introduction message on the dashboard. |
| 課題の統計 | The Issue Statistics Gadget displays the collection of issues returned from a specified filter, broken down by a specified field. |
| ラベル | Displays a list of all the labels in a specified project. |
| Pie チャート | The Pie Chart Gadget displays issues from a project or issue filter, grouped by a statistic type, in pie-chart format. The issues can be grouped by any statistic type (e.g. Status, Priority, Assignee, etc). |
| プロジェクト | The Projects Gadget provides information and various filters related to a specified project(s). |
| クイックリンク | The Quick Links Gadget displays a number of useful links to issues associated with the current user. |
| Recently Created Issues | The Recently Created Issues Gadget displays a bar chart showing the rate at which issues are being created, as well as how many of those created issues are resolved. |
| 解決時間 | The Resolution Time Gadget displays a bar chart showing the average resolution time (in days) of resolved issues. |
| ロードマップ | The Road Map Gadget shows versions which are due for release within a specified period of time, and a summary of progress made towards completing the issues in those versions. |
| Text | Displays a configurable HTML message. |
| 経過時間グラフ | Displays a bar chart showing the number of issues that something has happened to within a given time period. The 'something has happened' is based on a date field that you choose, such as 'Created', 'Updated', 'Due' or 'Resolved'. |
| Two-Dimensional Filter Statistics | Displays statistical data based on a specified filter in a configurable table. |
| 投票した課題 | Displays issues for which the current user has voted. |
| ウォッチ中の課題 | Displays issues that the current user is watching. |
More output formats
Next to feeding Gadgets, filters can also provide their data in different output formats. That enables the consumption of that data by third party tools:
| 形式 | 説明 |
|---|---|
| チャート | Similar to the Chart Reports or Gadgets mentioned above, it is possible to feed the results of a current search directly to a chart. |
| RSS | It is possible to turn the result list of a filter into an RSS feed which can then in turn be subscribed to. This is less relevant for report decks but a great way to realize alerts in case issues meet certain criteria. |
| メール | Similar to the RSS feed, a filter can also be subscribed to via Email in which case new issues found under the filter will be sent to the user's inbox. A good way to implement Alert notification. |
| Microsoft Word | With the MS Word output, JIRA provides the details of all issues produced by the filter in one Word file. This is very useful if documents need to be created that contain details such as the description of issues. An example could be aiding the creation of a Statement of Work (SoW) that consists of deliverables which are each defined in JIRA issues and tagged in a way that they can be summarized with a filter. |
| Microsoft Excel | MS Excel is still one of the most common reporting tools and is supported with this output format. Exported data can then be imported into Pivot Tables or modified using the many other Excel functionalities. |
| XML | JIRA also supports Issue Navigator output in XML to be used by other applications (such as Confluence with its JIRA Issues Macro). The XML response can thereby be configured to only include a number of requested fields. |
Advanced Output Formats
In addition to the pre-installed reports, gadgets and output formats, it is also possible to access JIRA data through more advanced methods. Please be mindful though that some of these methods are not supported by Atlassian support and should be only applied with the help of an Expert.
| Advanced Tool | 説明 |
|---|---|
| REST API | It is possible to request data from JIRA via its REST API. This will require either configuration of a third party tool or programming. |
| SQL | It is possible, however not recommended (see below), to access the JIRA Database directly via SQL. The advantage once SQL queries are set up is that its data can then be exported and joined with other data. See the JIRA Community space for some Examples of JIRA SQL queries. For other queries, please study JIRA's database schema.
|
Add-Ons
Next to the pre-installed features that JIRA provides out-of-the-box, there are plenty of reporting related add-ons available on Atlassian Marketplace. Given the sheer mass of add-ons on the Marketplace, please see below the most popular listed with each subchapter linking to the full list of add-ons. All the listed Add-Ons support at least JIRA 5.0 and are actively supported by their vendor.
JIRA Agile Reporting Tools
The JIRA Add-On JIRA Agile offers a number of reporting gadgets and tools that are specifically targeted to agile project management:
JIRA Agile Reporting Tool | 説明 |
|---|---|
Displays issues from one or more projects, in a flexible way of viewing, managing and reporting on work in progress for teams that work in sprints (iterations). | |
Displays issues from one or more projects, in a flexible way of viewing, managing and reporting on work in progress for teams that focus on managing and constraining their work-in-progress. | |
| Shows the cycle time or lead time for your product, version or sprint. | |
| Cumulative Flow Chart | An area chart that shows work-in-progress for a product, version or sprint. |
| バーンダウン チャート | Shows the actual and estimated amount of work to be done in a sprint. |
| スプリント レポート | Shows the list of issues in each sprint. It is useful for your Sprint Retrospective meeting, and also for mid-sprint progress checks. |
| ベロシティ チャート | Shows the amount of value delivered in each sprint, enabling you to predict the amount of work the team can get done in future sprints. |
Add-on gadgets
| Add-On | サブカテゴリー | Supported | 説明 | |
|---|---|---|---|---|
| Report, gadgets | by eazyBI | eazyBI is a powerful Jira reports, charts, and dashboards app. With eazyBI you can analyze and visualize Jira, Jira Service Desk, DevOps metrics, and data from most popular marketplace apps with an easy-to-use drag-and-drop custom report builder. | |
| Arsenale Dataplane | レポート | by Arsenale | Dataplane is designed for metrics-focused technical, product and project managers who require sophisticated charting and analysis of KPIs and trends in their JIRA data. |
 | Tempo - Painless Time Tracking and Reporting | タイム トラッキング | by TM Software | Whatever your drive is for time tracking, resource planning, or project management, look to Tempo for JIRA.Tempo and JIRA provide a painless way to connect your organization's activities and accurately report on them. |
 | JIRA Timesheet Reports and Gadgets Plugin | Gadgets, Time tracking | by Andriy Zhdanov | The Timesheet plugin extends JIRA time tracking with pivot reports, a "timesheet report" and corresponding gadgets for JIRA the Dashboard, and REST endpoints for external services. |
 | タイム トラッキング | by jPlugs | Jira Time Tracking Reporting Collection is a set of reports and gadgets presenting time tracking data. Version 3.40 for Jira 4 (and partly also version 3.06 for Jira 3.13.x) has also a significant better performance than earlier versions. | |
 | Column Order Gadget Plugin | Visualization | by Celix | The Celix Column Order Gadget Plugin enables a new gadget with a user-defined order of columns (Column Order Gadget). |
| Report Builder | Report, Gadgets | by Actonic GmbH | Benefit from the wealth of your existing Jira data by turning it into meaningful and easy to understand reports. Use templates or switch to expert mode and create custom reports from scratch! Enjoy full flexibility with HTML and JavaScript to exactly implement your individual requirements. Finally, add your reports as gadgets to your Jira dashboard for easy access. If you have specific needs, use Actonic's Report Building Service to have any report imaginable created for you! Interested to see more? Book a free demo here. | |

For more, see the complete listings of JIRA related gadgets on Atlassian Marketplace.
Reporting Add-Ons
| Add-On | サブカテゴリー | Supported | 説明 | |
|---|---|---|---|---|
| Report, gadgets | by eazyBI | eazyBI is a powerful Jira reports, charts, and dashboards app. With eazyBI you can analyze and visualize Jira, Jira Service Desk, DevOps metrics, and data from most popular marketplace apps with an easy-to-use drag-and-drop custom report builder. | |
| Arsenale Dataplane | レポート | by Arsenale | Dataplane is designed for metrics-focused technical, product and project managers who require sophisticated charting and analysis of KPIs and trends in their JIRA data. |
| レポート | by Old Street Solutions | Effortless creation of charts, reports and dashboards for your Jira & JSM data. Build, customize and share in seconds | |
 | JQL Tricks Plugin | Data extraction | By J-Tricks | JQL Tricks plugin is a plugin which has a set of useful JQL Functions for JIRA. Those include simple JQL functions to complex ones. Use this to further refine your filters that you use for report generation. |
 | Craftforge JQL Functions Plugin | Data extraction | By Craftware Sp. z o.o. | Set of JQL functions extending JIRA search capabilities, especially full subqueries support based on saved filters (subquery) and relations/links between issues. Works on any issue link/relation, even subtask/parent relation. |
 | JIRA Command Line Interface | Data extraction | by Bob Swift Software LLC | The command line interface enables you to remotely access a JIRA instance, providing a convenient way to automate JIRA operations. Through this add-on, it is possible to retrieve issues from JIRA (e.g. through the getIssueList action) that can then be processed on a script level and serve as input for reporting. |
| Report Builder | Report, Gadgets | by Actonic GmbH | Benefit from the wealth of your existing Jira data by turning it into meaningful and easy to understand reports. Use templates or switch to expert mode and create custom reports from scratch! Enjoy full flexibility with HTML and JavaScript to exactly implement your individual requirements. Finally, add your reports as gadgets to your Jira dashboard for easy access. If you have specific needs, use Actonic's Report Building Service to have any report imaginable created for you! Interested to see more? Book a free demo here. | |

For more, see the complete list of Image, Visualization & Reporting Add-Ons for JIRA on Atlassian Marketplace.
Connectors to Third Party Reporting software
| Add-On | Third Party Tool | Supported | 説明 | |
|---|---|---|---|---|
| Power Dashboards, Reports & Gadgets | Perform complex calculations, reporting visualizations, pre-built reports. Create reports using HTML, CSS and JavaScript | By Appfire | |
| nFeed - Connecting Databases, Remote Files, and Web Services to JIRA | SQL Databases, Remote Files, REST web services | By Valiantys | nFeed can query any data source, and select multiple values directly within your JIRA screens. |
| Power BI Connector for Jira | No-code Power BI Jira integration. Connect Jira to Power BI and build custom Jira reports easily. Use templates for a quick start | By Alpha Serve |
| |
| ... | ||||


For more, see the complete list of Integration Add-Ons for JIRA on Atlassian Marketplace.
Types of Reporting
As we have looked at all the technical tools, reporting Gadgets and other Add-ons, it is time to focus on why and how we want to use them.
Please note that especially this section is alive and not set in stone. Please contribute and share your best practices in how to achieve the reporting goals of the different types of reports below.
Individual reporting
Goal: Get an overview of your work assignments and identify possible issues that are in danger to be overdue.
| Sub-Reports | Example JQL Filter | Examples Reports / Gadgets |
|---|---|---|
| Current Work Assignments | | RSS Feed in combination with Browser Live Bookmarks |
| Assignments that are overdue or due in the next 7 weeks | | |
| Very old open assignments | When you copy&paste the XML URL into the Gadget, you can set the tempmax parameter to 5 to show only the 5 oldest issues. | フィルター結果 |
| Latest updated issues reported by me | | フィルター結果 |
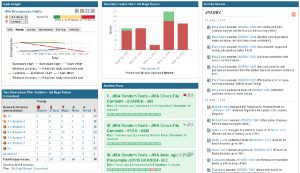
| Example of My Issues Dashboard | Example for JIRA Developer Dashboard |
|---|---|
 |  |
Team reporting
Goal: Remain informed over the workload and performance of your team.
For these examples to work, your team members need to be part of user group 'team-name' or you will need to add each user name in the JQL manually (not recommended).
| Sub-Reports | Example JQL Filter | Examples Reports / Gadgets |
|---|---|---|
| Assigned to team | | |
| Assignments that are overdue or due in the next 7 weeks | | |
| Team Workload | Same as "Assigned to team", but you could break it up by versions or use an add-on gadget. | |
| Realtime Team Updates | In the activity stream gadget, you can filter the notifications by users (write the user names in the filter separated by space). | アクティビティ ストリーム |
| The Angry Nerds Teamboard | Example Team Dashboard |
|---|---|
 |  |
Release reporting
Goal: One overview of the health and status of an upcoming release. This dashboard should aid the release manager in the decision whether to approve a release.
| Sub-Reports | Example JQL Filter | Examples Reports / Gadgets |
|---|---|---|
| Open issues assigned to release | | |
| Overall state of this version | | Pie Chart (select resolution as statistic type) |
| Realtime Updates | Add a filter to see the latest updates in the project as the release comes closer. You will have to set the filter in the Activity Stream to the project that the release is relevant to. | アクティビティ ストリーム |
| Spill over | Issues that were assigned to the last released version but did not make it and were thus spilled over to this version | Pie Chart (you can select various attributes as possible statistic type such as component, issuetype, etc) |
| Issues that were rejected by QA | This example query needs to be adjusted for whatever custom statuses are implemented for QA review. |
| Example for a Release Health Dashboard | Example of a Spill Over Board |
|---|---|
 |  |
The example above additionally shows Bamboo gadgets that show the status and health of Bamboo plans.
Project Management Reporting
Agile Project Management
Goal: Visualize the product backlog, the status of the current Sprint and the preview for the next iteration.
Certainly, the answer for agile project management is JIRA Agile. Please see below a number of sub-reports that are common in agile development:
| Sub-Report | 例 | Example Report / Gadget |
|---|---|---|
| Product Backlog | In this view, you want to see all open issues for your project in a backlog ordered by priority. JIRA Agile has that priority built in so you can rearrange issues by drag&drop. Alternatively, you could create a filter that orders issues in a project by a custom priority field and show those using the Filter Results gadgets or jiraissues macro in a Confluence page: Whereas "Backlog Order" is your custom field to manage granular priorities among issues. | |
| Sprint Overview | In this subreport, you want to see the status of the current Sprint, especially in regards to the status of its assigned issues. The Column view of JIRA Agile's Scrum Board provides this overview. | Scrum Board - Work Mode |
| バーンダウン | An alternative way to visualize the status of the current sprint is to show the actual burn down of story points in context to time - especially the end of the sprint. | バーンダウン チャート |
| ベロシティ チャート | As an agile project manager, you will want to be able to predict the team's future velocity based on the past sprints' results. The velocity chart provides this overview. | ベロシティ チャート |
Additionally to the examples listed above, there are also more reports available for JIRA Agile.
| Example Product Backlog | Example Sprint Overview | Example Burndown Chart |
|---|---|---|
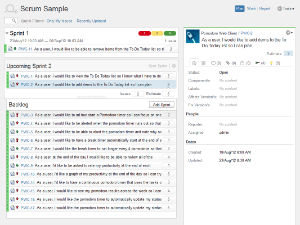 |  |  |
Traditional Project Management (Waterfall)
Goal: To provide an overview of a project's status in accordance to its plan.
| Subreport | 例 | Example Report / Gadget |
|---|---|---|
| Project Overview (Gantt) | To provide a project overview including time, tasks and dependencies. | Ceptah Bridge (MS Project integration) |
| プロジェクトの要約 | See activities, current issues and a 30 day overview of created/resolved issues. | |
| Project Roadmap | See upcoming versions and optionally their assigned tasks. To see assigned tasks, you can create a filter to show issues of certain types for the respective project and then create a single level group report by fix version. |
| Example Gantt chart with JIRA Gantt Chart | Example Project Backlog |
|---|---|
 |  |
Service Management Reporting
Goal: In Service Management reporting, to provide insight of the status of incident, problem and change management as well as provide a decision basis for incident, problem and change control.
| Sub-Reports | Example JQL Filter | Examples Reports / Gadgets |
|---|---|---|
| Open Incidents, Problems, Changes by Priority | Use this JQL as a basis and replace "Your_Project" with your project key if this report is to be project specific. Also replace "Respective_Type" with the issuetype key of either Incident, Problem or Change Request. | JIRA issues macro on a dedicated Confluence page You could also use JIRA Agile's Board to prioritize Change Requests for example |
| Recently closed Incidents, Problems, Changes | In this query, all issues that have been resolved within the last seven days (-7) are shown. | JIRA issues macro on a dedicated Confluence page |
| Recently opened Incidents, Problems, Changes | In this query, all issues that have been resolved within the last seven days (-7) are shown. | JIRA issues macro on a dedicated Confluence page |
| Delta of Created vs Resolved | | Created versus Resolved Issues (with a filter saved with a JQL query to the left) To quickly visualize in a Chart the overal development of incident / problem management |
| SLA Compliance | Immediate alert when issues are about to violate the SLA targets. 3rd Party Add-Ons provide this functionality such as VertygoSLA. In case you don't have an add-on installed, you could also create a filter that catches all open issues that are older than a specific age. This does not reflect a true solution time (since time intervals in which the ticket was 'pending' are counted as well) but will get you started: The example above filters for all open issues that are older than 30 days. | |
| Identifying problem areas | Issues that have been reopened on and are now in progress within this month Issues that have been reopened and priority was changed | フィルター結果 |
Time reporting
Goal: Learn about the time spent by team member, by issue and deviation from time budgets / estimates.
| Subreport | 例 | Examples Reports / Gadgets |
|---|---|---|
| Time spent per issue | You can see time spent within the issue view. | |
| Time Tracking overview | See issues, their estimates, spent time and time left. | 時間管理レポート |
| Time spent per user per issue | To see who spent most time in an issue, you can create a pivot timetracking report with an add-on. Also, you can export the data to a third party application like Excel for further studying. | Timetracking report and portlet MS Excel |
| Time logged per user | Add-Ons allow the view on logged time per user within a given time period. | |
| Issues with most time spent | | フィルター結果 |
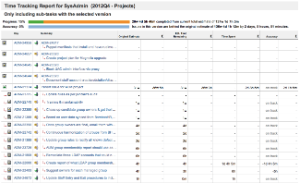
| Example: Time Tracking Report | Example: Time logged per user |
|---|---|
 |
|

Cross-Project and Cross-Instance reporting
Goal: Retrieve Key Performance Indicators from multiple projects in either one or multiple instances
A way to achieve this is to make one JIRA server the central reporting instance (from now on referred to as 'central JIRA') and connect it via Applinks to all instances it should report on. Once the link is set up, you can add the gadgets you want to report on to your central JIRA's gadget directory.
| Subreports | ||
|---|---|---|
| Multi-instance project overview | To have one Dashboard with projects from all of your instances, you can create gadgets at each of these instances and then add their gadget URLs to your central JIRA's gadget repository. | プロジェクトガジェット |
| Joined reports | If you want to join data from different JIRA instances, you will have to use a third party tool such as BIRT with the PowerReport add-on to bring the JIRA data together. Be mindful however, that each JIRA instance might have different structures such as custom fields, version definitions, etc. | PowerReport |
More Resources
Presentations
| Killer reporting with JIRA dashboards |
|---|
| Video and Slides |
Atlassian Answers
 How to Create summary report on # of linked ticket?
- How to group report/gadget/filter results by month?
- How to create a report of watches issues in JIRA 4.4
- What reporting capability is available from JIRA?
Blog and Knowledge Articles
- 5 Steps to Build a Killer Dashboard: the information you need, when you need it (September, 2012)
- The JIRA Dashboard at the center of your development process (May, 2010)
- Best Practice: Using JIRA For Time Tracking
- Importing JIRA data to Google Apps (September, 2009)
エキスパートと協力
We can help connect you with a right Partner / Expert. If you're interested for a referral, please contact us.

コメント
Please note that this is a live document and the best practices here are not set in stone. Please contribute your best practices, questions and comments around reporting to Atlassian Community:
![]()