JIRA Running out of memory due to GC / Allocation race condition
プラットフォームについて: Server および Data Center のみ。この記事は、Server および Data Center プラットフォームのアトラシアン製品にのみ適用されます。
Support for Server* products ended on February 15th 2024. If you are running a Server product, you can visit the Atlassian Server end of support announcement to review your migration options.
*Fisheye および Crucible は除く
問題
High level summary
Jira suffers from multiple OutOfMemory (OOM) errors that cause some disturbance in the service. The root cause is the fact that Java is running into fake OOM due to race conditions, we don't have actual Heap memory problems.
詳細
Jira suffers from multiple OOM errors that cause some disturbance in the service, Jira experiences a performance problem before the OOM and could also have some inconsistent data due to the out of memory condition.
The out of memory condition resolves itself after some time, Jira/Java doesn't crash.
The following appears in the atlassian-jira.log:
atlassian-jira.log.1:2018-07-10 09:38:40,539 http-nio-8080-exec-18  username:user  ERROR user 111x111x1111 xxxxxx 10.10.10.10,10.10.10.11 / [c.atlassian.velocity.DefaultVelocityManager] MethodInvocationException occurred getting message body from Velocity: java.lang.OutOfMemoryError: Java heap space
atlassian-jira.log.1:java.lang.OutOfMemoryError: Java heap space

atlassian-jira.log.2:2018-07-10 08:57:06,255 http-nio-8080-exec-211 username:user1  ERROR user1 111x11111111x1 xxxxx 10.10.10.10,10.20.20.10 / [c.atlassian.velocity.DefaultVelocityManager] MethodInvocationException occurred getting message body from Velocity: java.lang.OutOfMemoryError: Java heap space
atlassian-jira.log.2:java.lang.OutOfMemoryError: Java heap space
The OOM is not actually related to any of the above class names or functionality, it just happens that the OOM condition hits while those are executing.
In tomcat standard output (catalina.out) we see a heap dump file generated if heap dump on out of memory is enabled:
java.lang.OutOfMemoryError: Java heap space
Dumping heap to /opt/heapdumpsprod/java_pid111111.hprof ...
Heap dump file created [17377081490 bytes in 178.130 secs]
診断
環境
- Jira is running on tight memory conditions + under high load.
- Jira is using G1 collector.
Diagnostic Steps
- Need to collect Java Garbage collection logs, GC logs will help us diagnose the GC behavior.
- GC logs will show a scenario that results in a race condition between allocation and GC activity.
- Full GC is not able to kick in in time, this results in an out of memory to be thrown, once Full GC is allowed in, the garbage in the heap is collected and heap is emptied.
- The GC logs could show something like the below pattern, in this case Full GC was blocked by GCLocker_Initiated event that is initiated probably from executing a native code critical section.
GCLocker Initiated GC
GC is triggered when a JNI critical region was released. GC is blocked when any thread is in the JNI Critical region. If GC was requested during that period, that GC is invoked after all the threads come out of the JNI critical region.
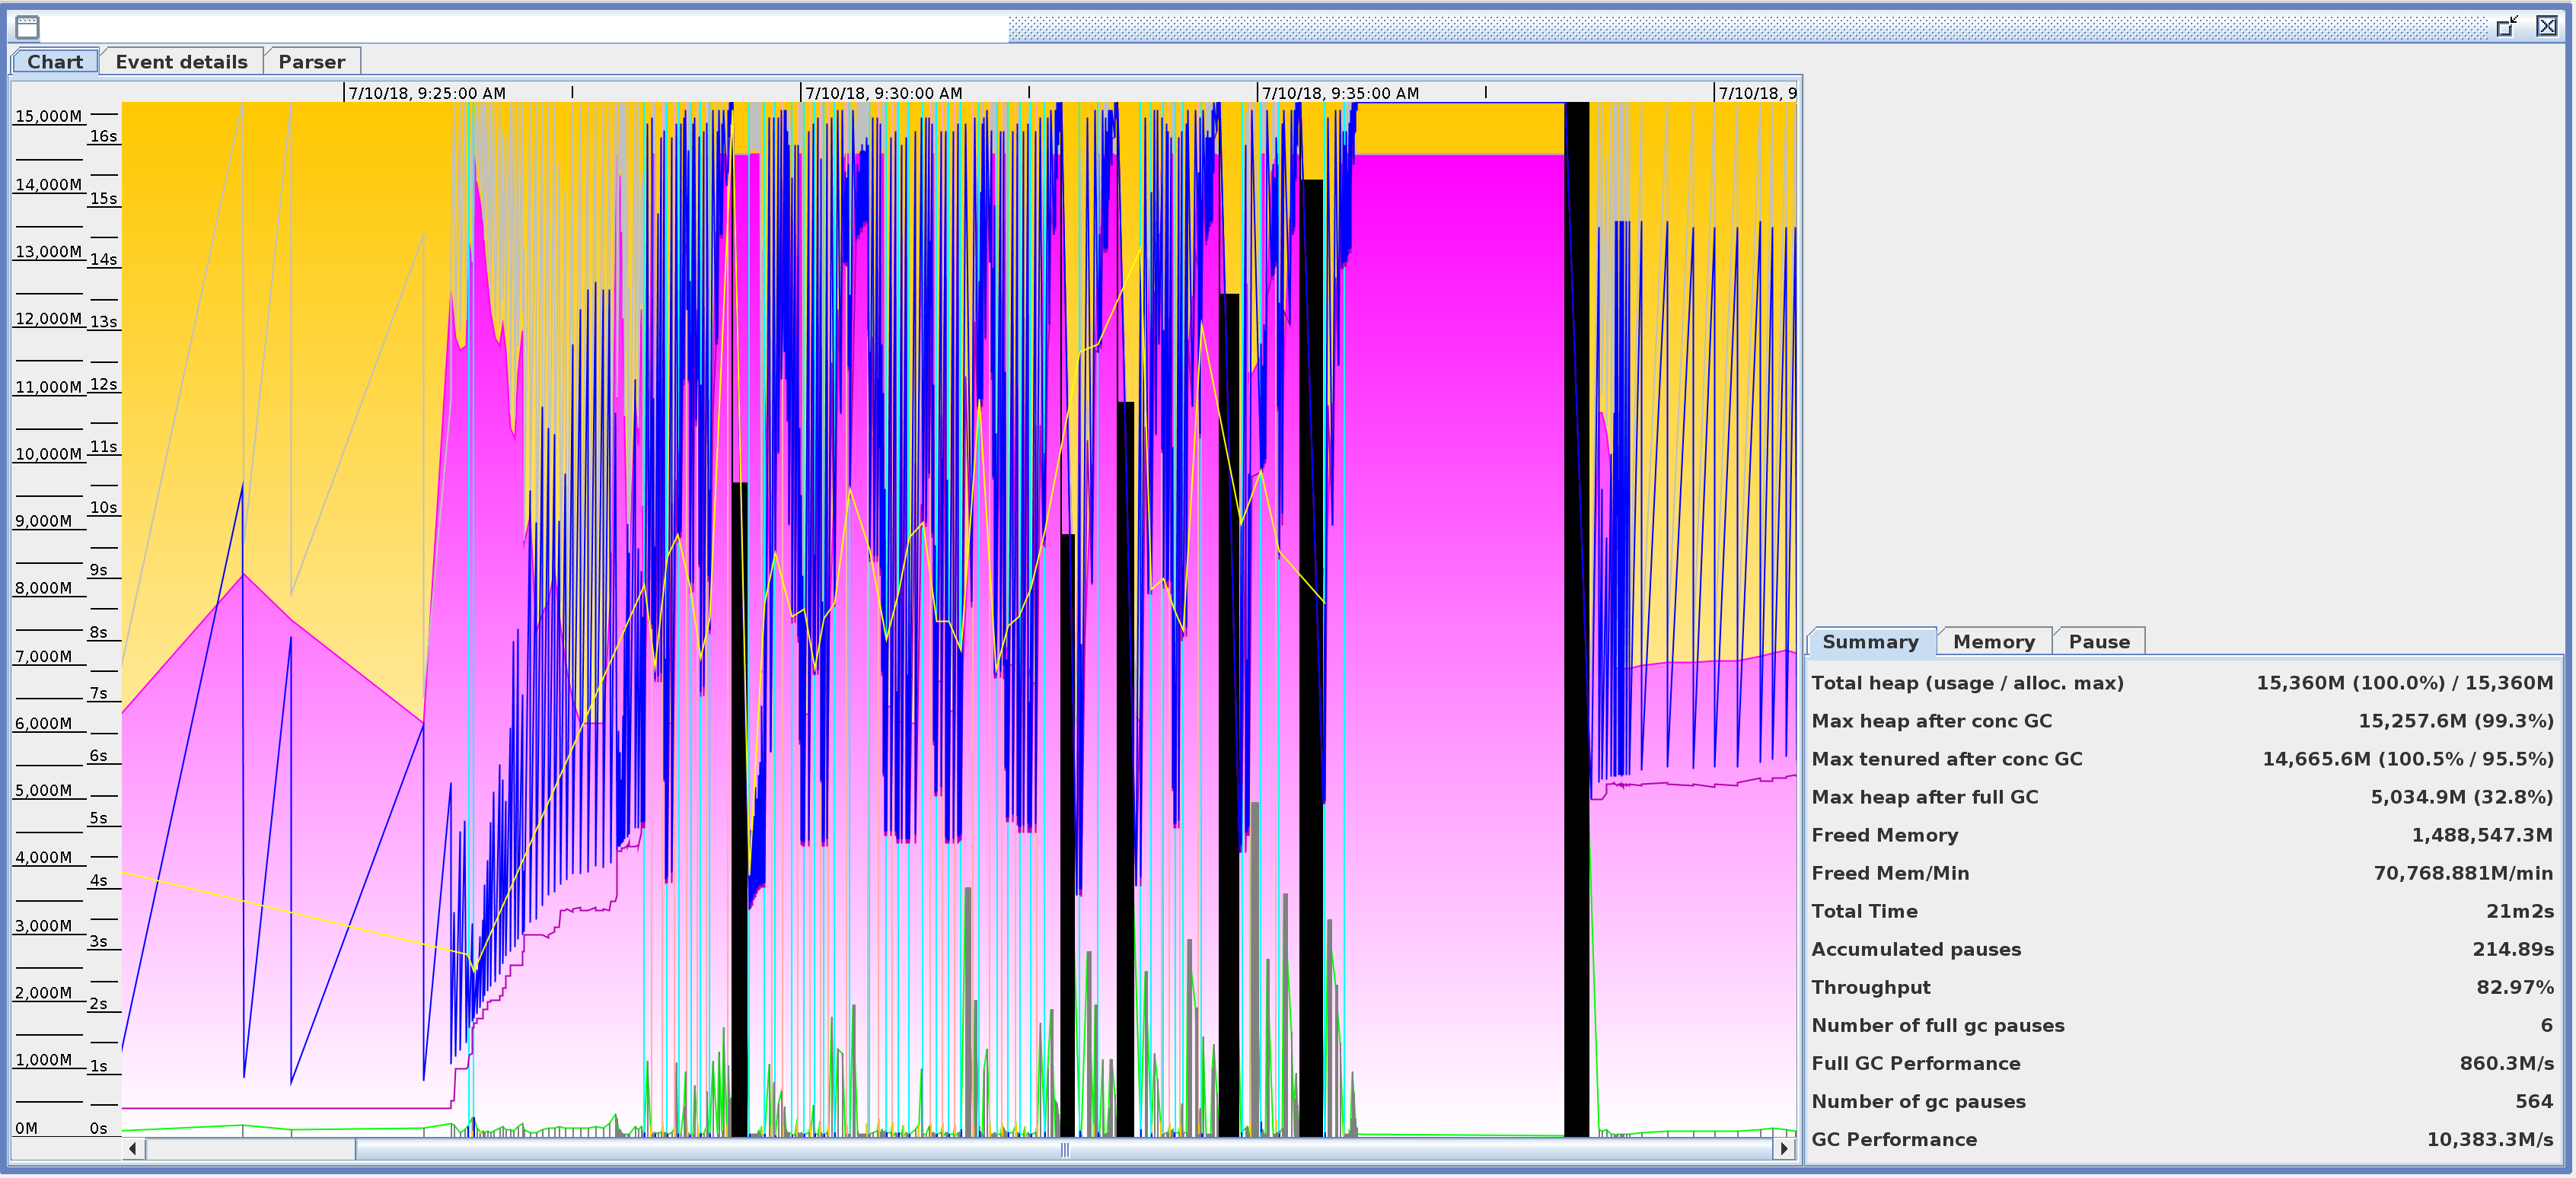
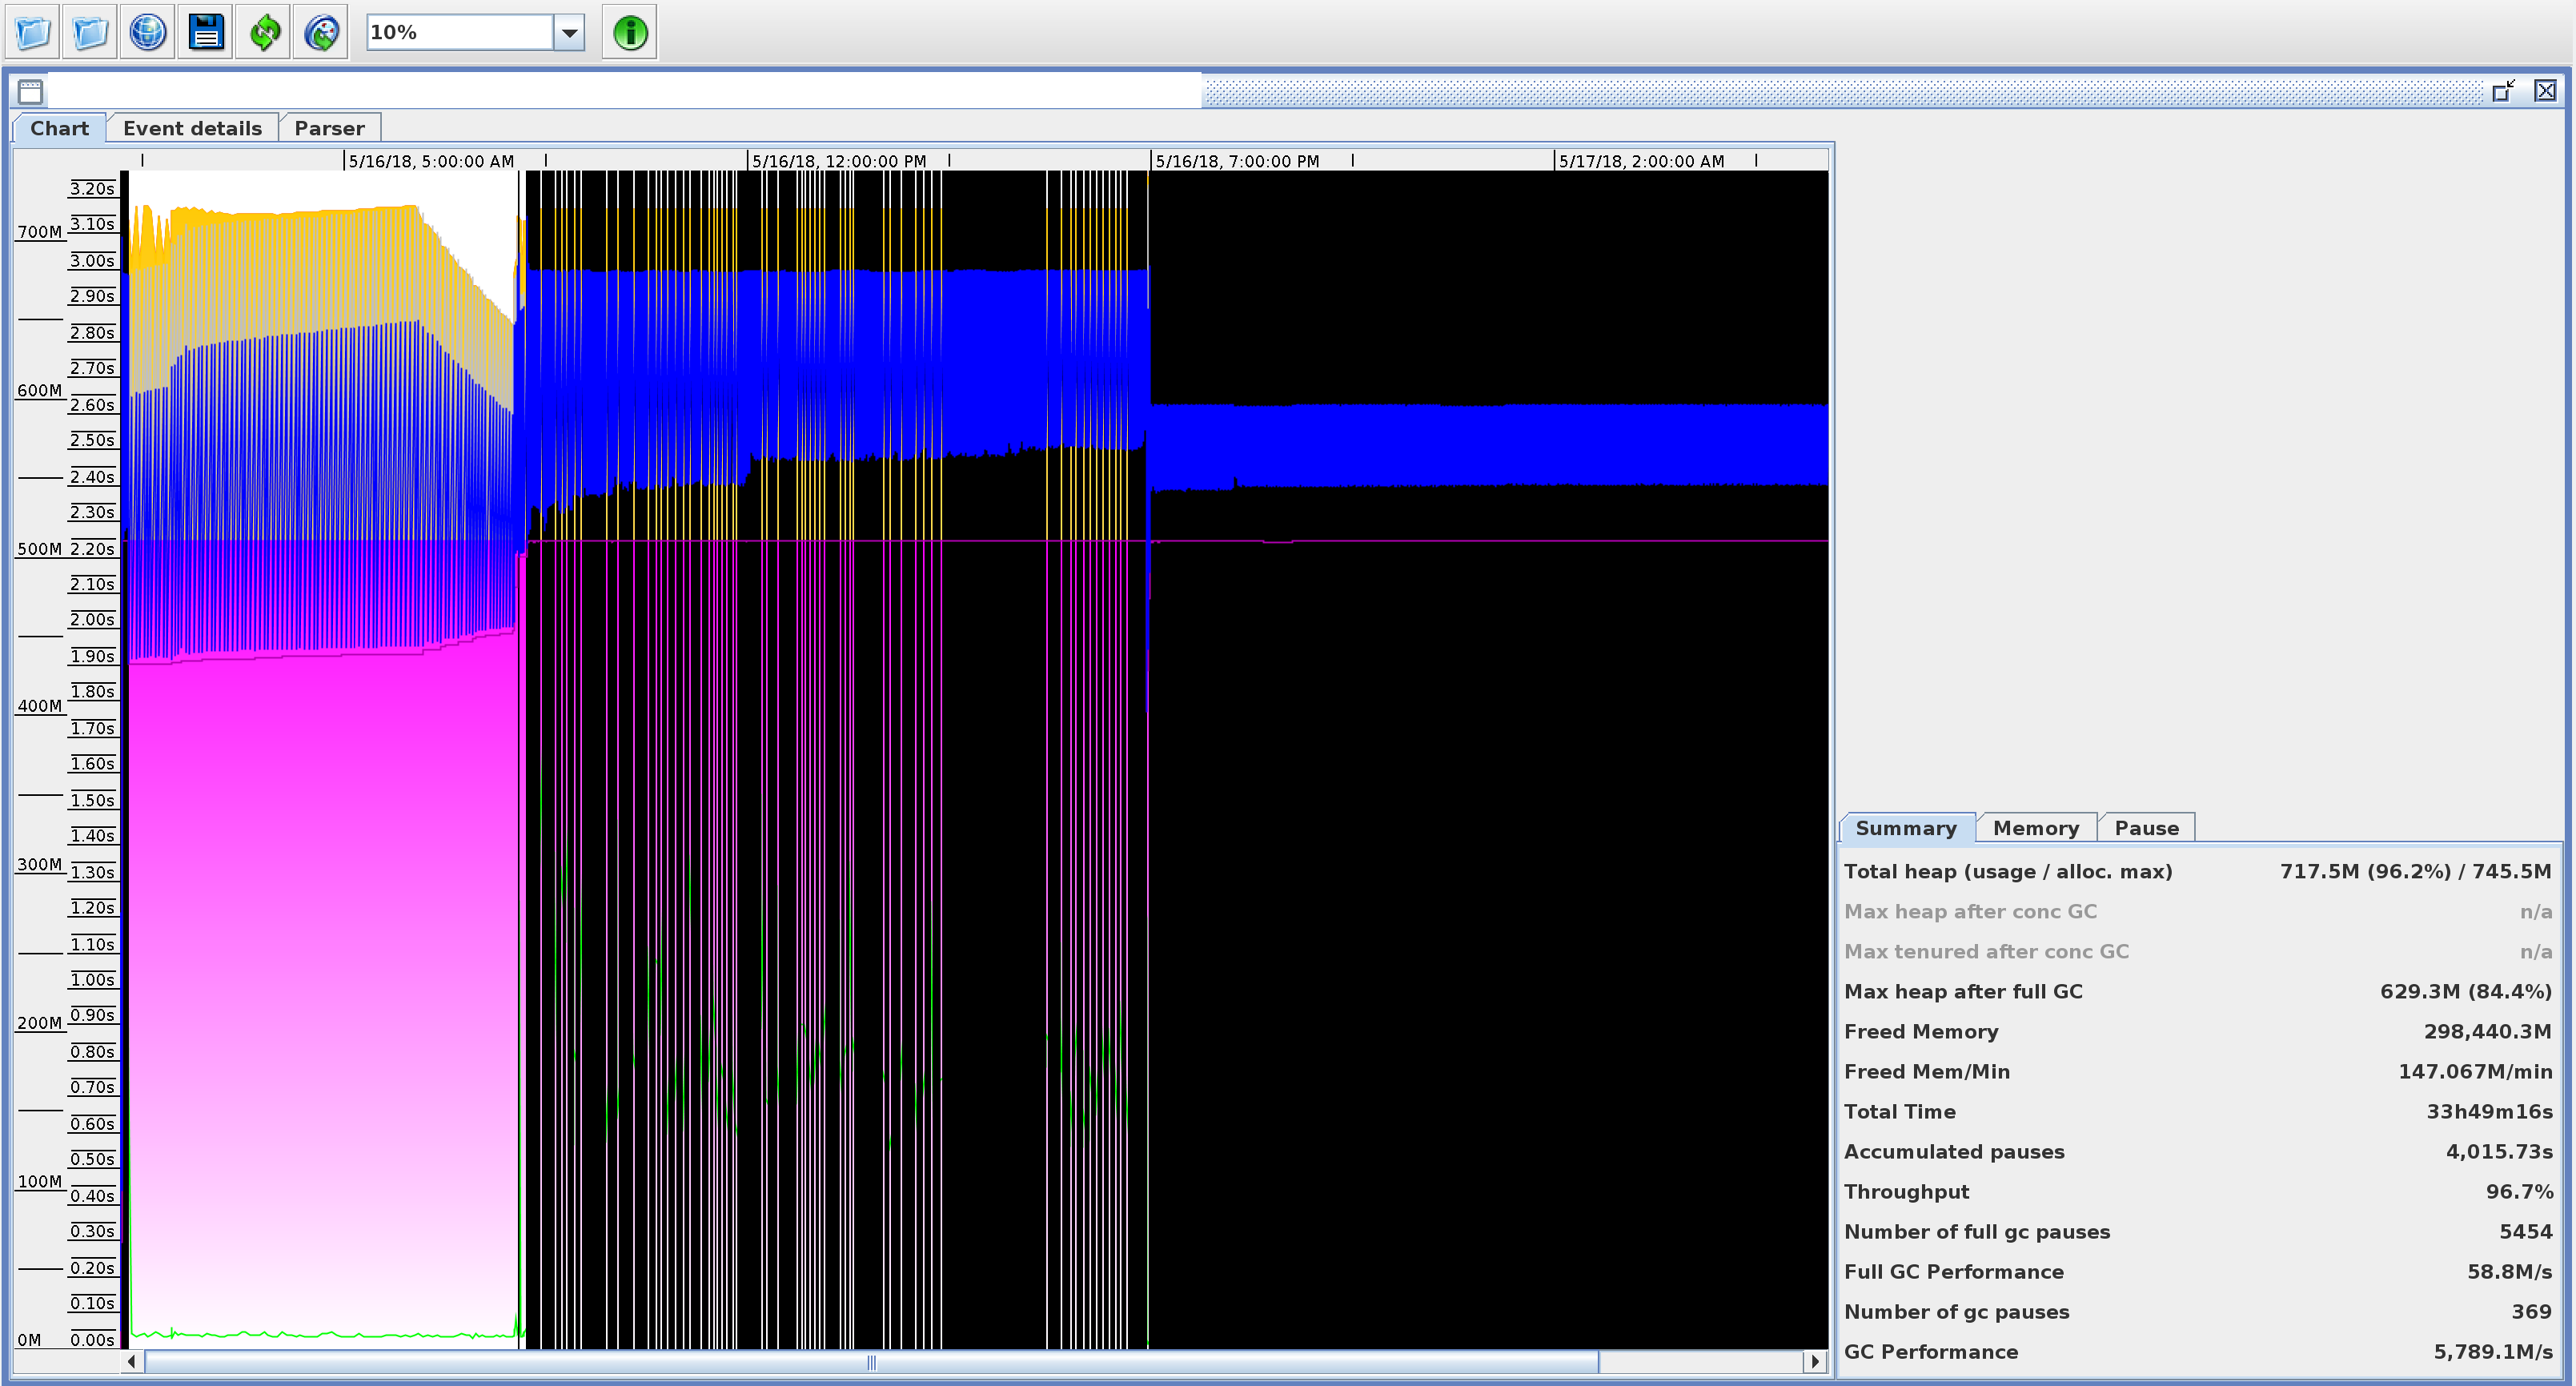
- Below is how the GC log analysis look like in case of a fake OOM condition and in case of a real OOM condition:
- Below is the time line of GC events that were happening just before the OOM was noticed until the Full GC was allowed to collect the heap:
| G1 was doing pauses for Humongous allocations and those were not taking long at 2018-07-10T07:20:53.089. Then due to the code execution stat, G1 was faced with GCLocker Initiated GC at 2018-07-10T07:20:53.134 | |
| The GC locker blocked the Full GC to happen when it was needed and thus the out of memory was thrown around 2018-07-10 07:20:51 | |
| From the GC logs, the GC locker was still happening until 2018-07-10T07:23:51.918 which is almost 3 minutes later: | |
Full GC only kicked in at 2018-07-10T07:23:52.035 and was able to clear the heap from 14GB to 6.4GB in 17 seconds. The GC locker kept the full GC from running for 3 minutes, due to the fact that the code execution reached to a critical native section before GC was allowed to run. | |
The out of memory condition is cleared and Jira is able to execute again. If we look at the heap dumps generated, we will see huge amounts of unreachable objects or actually, just a small heap corresponding to the base line memory after GC managed to collect. The out of memory is a fake out of memory condition due to the race condition. | |
原因
This is a typical race condition that happens, if the GC needs to kick in and the code is in an execution stat that doesn't allow GC to happen, in case above, due to the fact the the code is executing some native critical sections.
We have a clear race condition between GC and allocation/code execution that is happening only when there is memory pressure, this results in having Java generate fake out of memory errors, but then when the GC is able to kick in, the heap is actually cleared and the instance is able to recover memory.
Adding more heap also could be a contributing factor in making the race condition harder to happen, if done carefully. But if memory pressure happens with the new value of the heap, there is a chance that this problem might happen once more.
Another factor is that Java was executing native code while the allocation request that caused the out of memory was raised, this prevented the GC threads from doing a full GC to fulfill the allocation and thus the out of memory was thrown. this race condition is likely to happen once more as JIRA does use libraries that make use of native code like Lucene for example.
Please check the below Java bugs that touch the same problem described above:
- https://bugs.openjdk.java.net/browse/JDK-8137099 - OoME with G1 GC before doing a full GC
- https://bugs.openjdk.java.net/browse/JDK-8140597 - Forcing an initial mark causes G1 to abort mixed collections
- https://bugs.openjdk.java.net/browse/JDK-8151176 - Current default settings for static IHOP may result in concurrent marking never occurring
回避策
なし。
This problem is not related to Jira, this is an environment problem, and is not an application problem.
Jira need to have enough resources like: fast disk and fast network, enough CPU, etc, to make executing native code sections faster, also proper memory analysis and tuning could help avoid this condition.
Adding more heap can result in worse results if Jira memory and GC is not tuned, this can cause longer pauses that could result in worse performance conditions.
Extra
In Java 8 , you can enable extra GC logging for JNI GC stalls: PrintJNIGCStalls - Reports if GC is waiting for native code to unpin object in memory.
"%.3f: Allocation failed. Thread \"%s\" is stalled by JNI critical section, %d locked."
Java 8 : JVM args should be:
-XX:+PrintGCDetails -XX:+PrintJNIGCStallsDo not use these args with Java 11, as they are not known in that version and will therefore prevent Jira from starting.

