How to analyze performance diagnostics ( thread dumps, heap dumps, garbage collection logs )
プラットフォームについて: Server および Data Center のみ。この記事は、Server および Data Center プラットフォームのアトラシアン製品にのみ適用されます。
Support for Server* products ended on February 15th 2024. If you are running a Server product, you can visit the Atlassian Server end of support announcement to review your migration options.
*Fisheye および Crucible は除く
A quick overview of some of the tools Atlassian Support uses to diagnose performance problems and the basics of using them
Garbage Collection Log Analyzer
GC Viewer is used for analyzing garbage collection logs ( see Capturing heap dumps before FullGCs to troubleshoot memory problems ). Garbage collection logs can help identify whether performance is impacted by application pause times caused by large memory objects.
Opening a GC log in GC Viewer resembles the following:
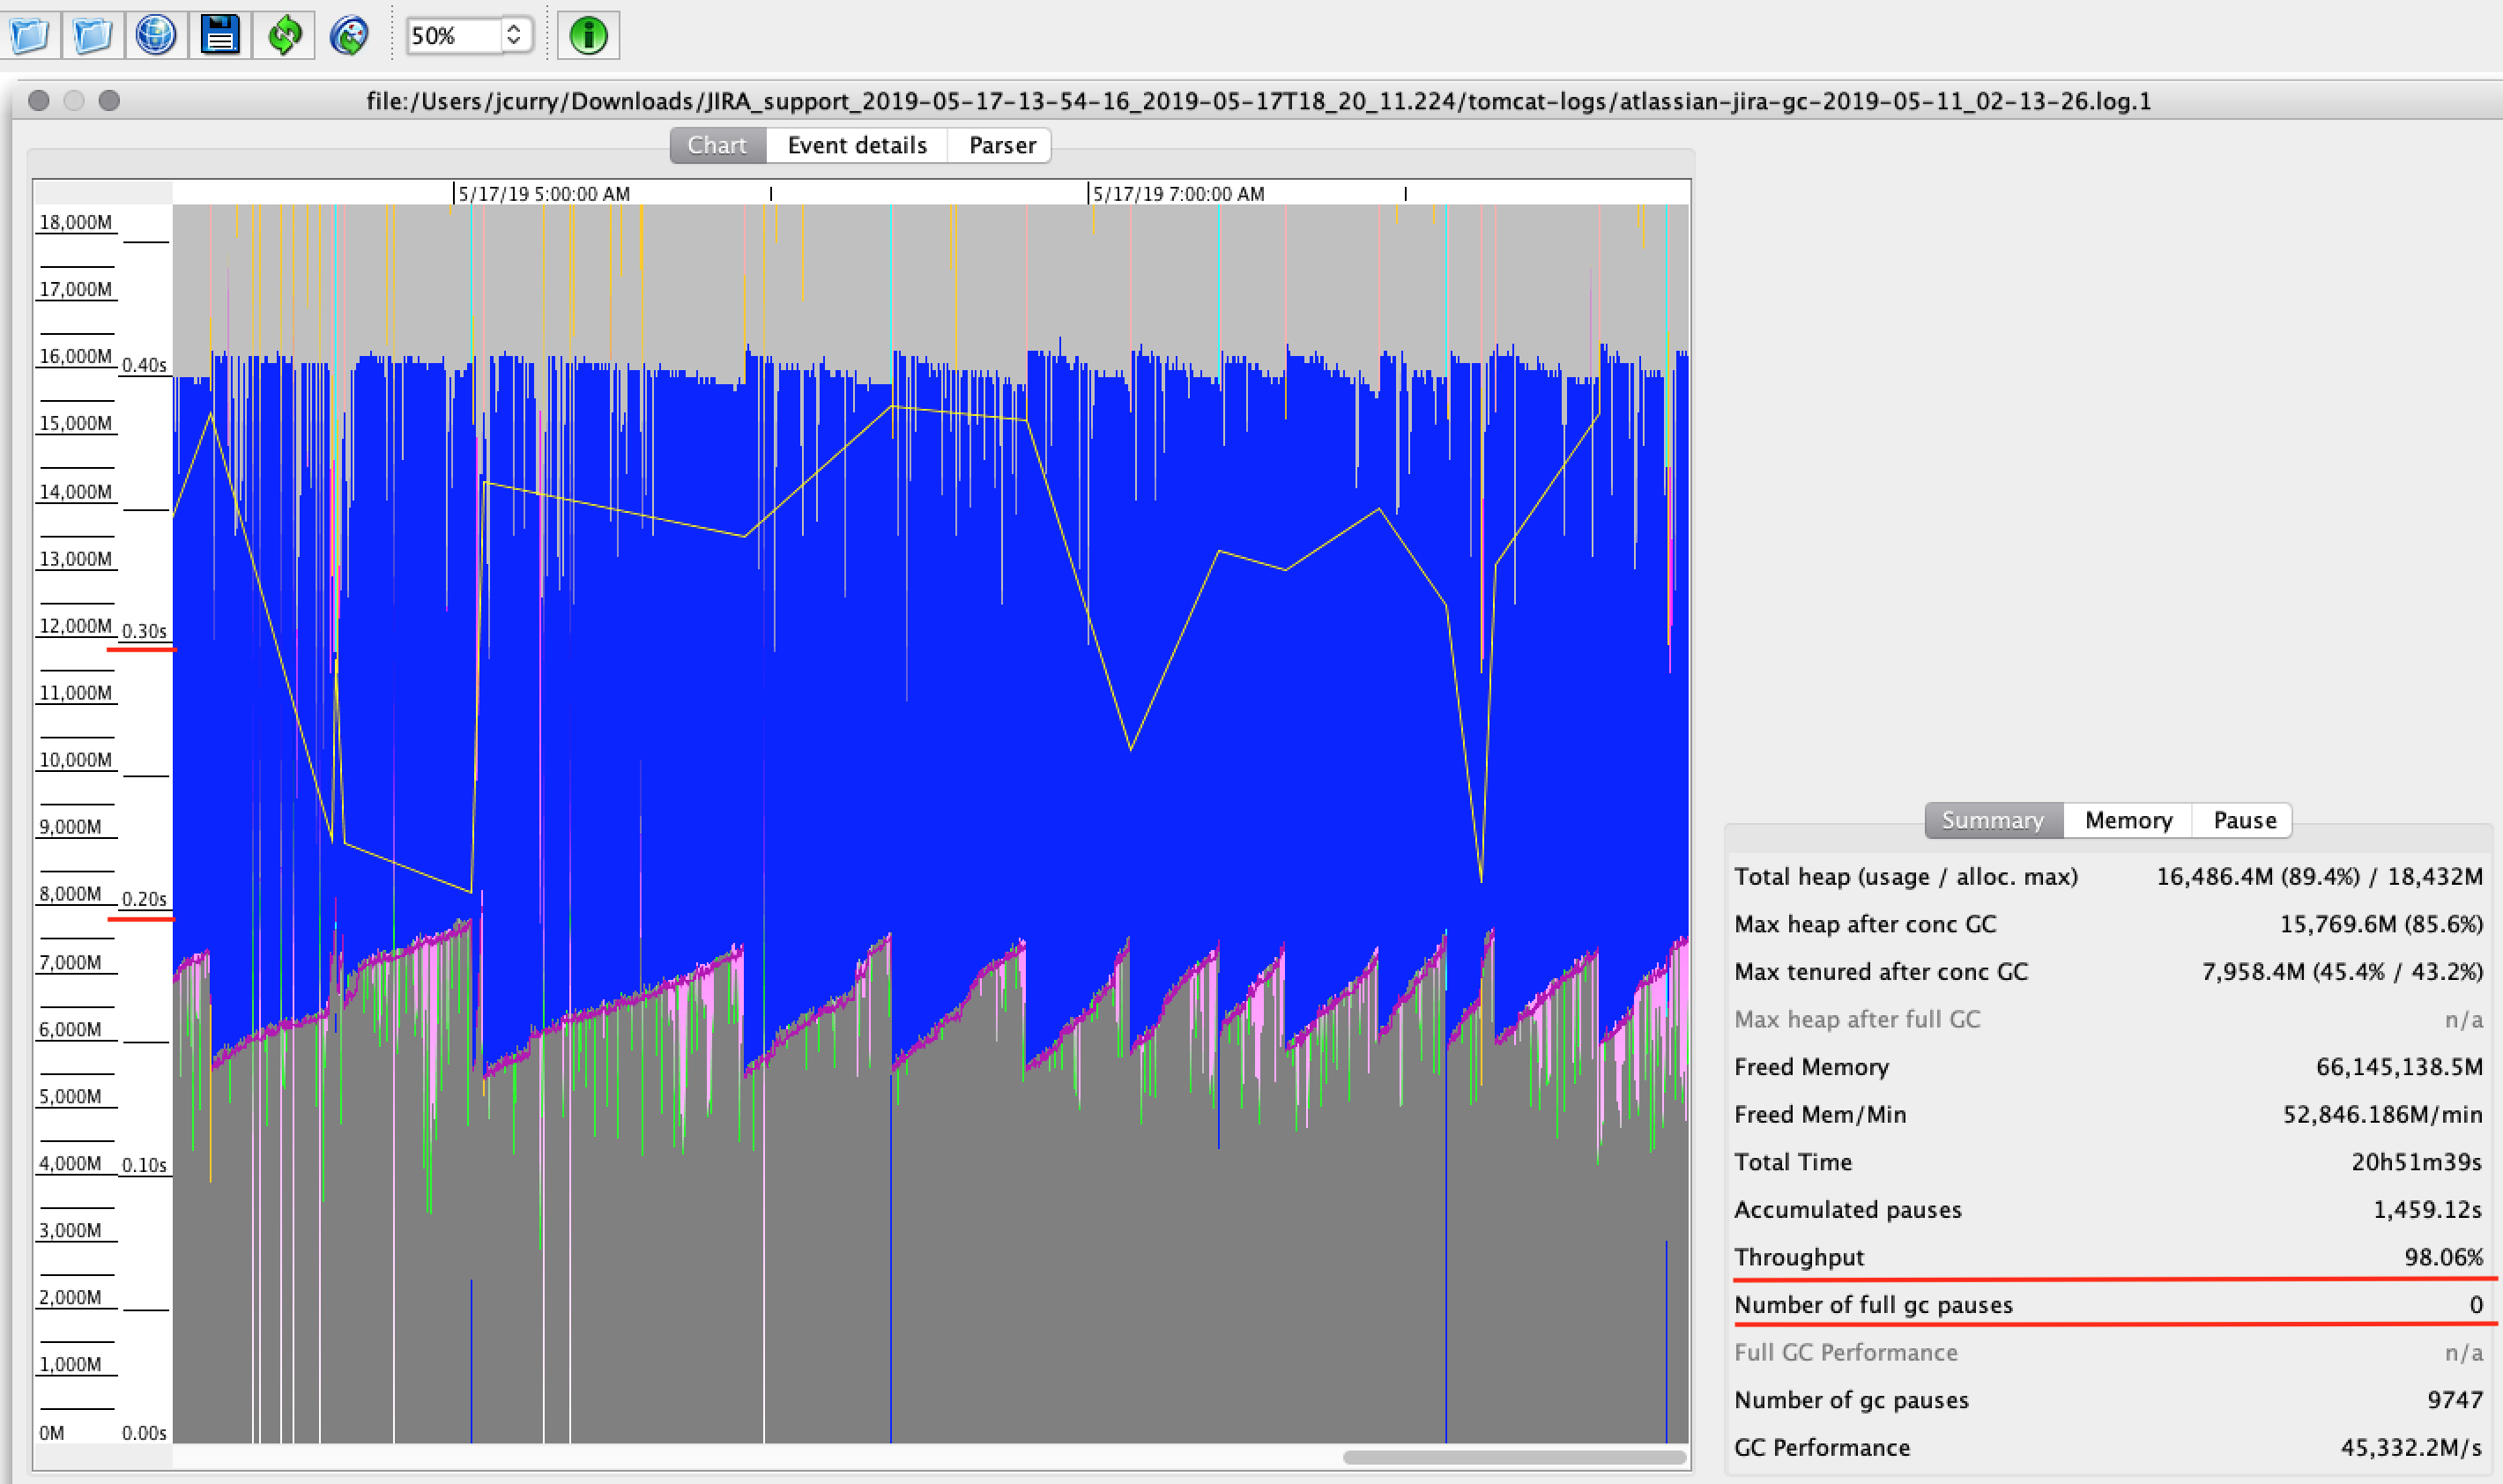
Two key metrics are Throughput and Number of full gc pauses which are depicted on the right. Throughput measures how much an application spent garbage collecting while a full gc is when the application pauses while garbage collection is performed. Anything above 95 percent for Throughput is acceptable. For the amount of full gc pauses you'll want to look at the times depicted on the left which represent how long the application paused due to garbage collection. A few pauses below 5 seconds is normal. One or more pauses greater than 15 seconds is not.
Thread Dump Analyzer
Atlassian has since developed its own thread dump analyzer called Watson
Thread Dump Analyzer is used for analyzing thread dump files ( see Troubleshooting Jira performance with Thread dumps ). Each thread dump file can be thought of as a snapshot in time and details the specific JVM threads that were running at the time the thread dump was captured.
Opening a set of thread dumps in TDA resembles the following:

In this example we have six thread dump files captured approximately 10 seconds apart with the first three expanded to detail when they were taken. 10 seconds of application time is really long in regards to thread execution time so unless a thread is executing a long-running service or something similar we don't expect to see the same thread running across multiple thread dumps in general.
Let's see what thread were running at 19:17:56 on June 26th 2019:

Take note to sort threads by state as depicted here. While this thread dump contains 123 threads only a handful are currently running. Clicking on a thread on the right will provide further details:

In this example we can see the "LexoRankReindexer:thread-1" was running across multiple thread dumps. Since this thread/job is expected to take awhile it is not a concern.
In a real-world scenario with lots of actively running threads you will want to start looking at the CPU top files first which will depict how much CPU time each thread is using. From there you can find the specific thread in TDA using the Native-ID column.
Heap Dump Analyzer
Eclipse Memory Analyzer Tool ( MAT ) is used for analyzing heap dump files which contain objects in memory. Each heap dump file can be thought of as a snapshot in time and details the memory occupied by specific JVM threads.
Running the Leak Suspects report is a good place to start which will depict the largest objects in the heap dump. Typically a few large objects occupy most of the available JVM memory, causing performance problems.