How SLA goals report vs SLA success rate report is calculated in Jira Service Management
プラットフォームについて: Server および Data Center のみ。この記事は、Server および Data Center プラットフォームのアトラシアン製品にのみ適用されます。
Support for Server* products ended on February 15th 2024. If you are running a Server product, you can visit the Atlassian Server end of support announcement to review your migration options.
*Fisheye および Crucible は除く
目的
The purpose of this knowledge-based is to explain further on how SLA goals vs SLA success rate report in Jira Service Management is calculated.
SLA goals report
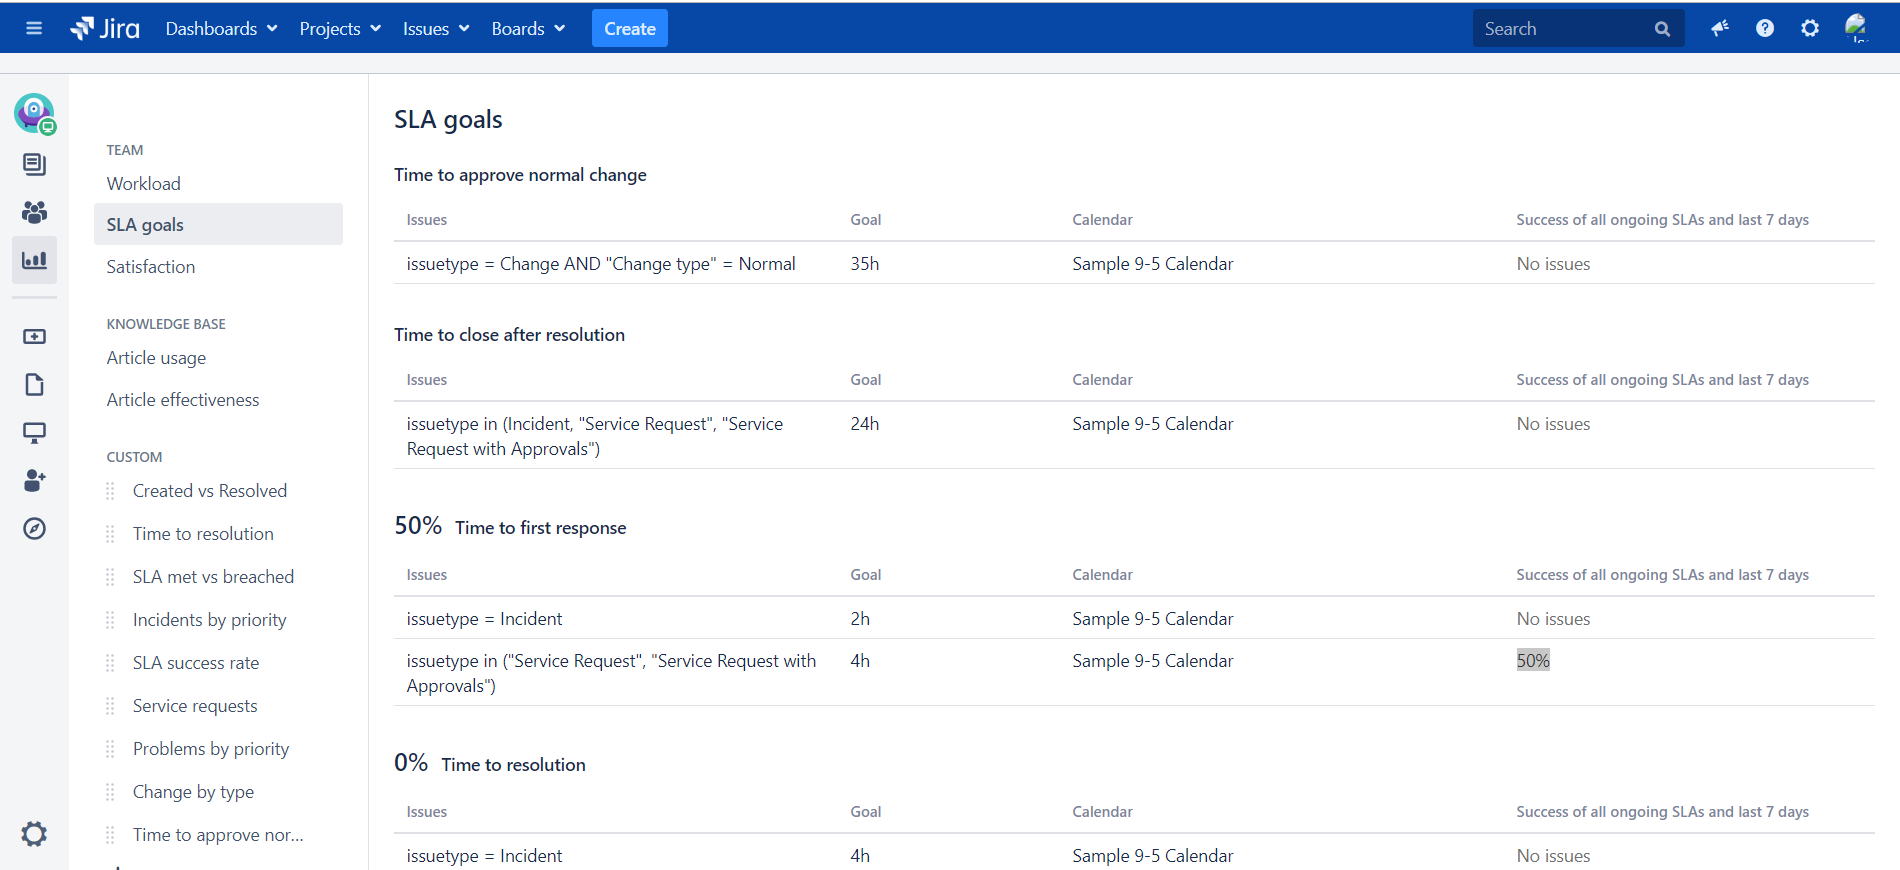
How SLA goals report calculated taken from Reporting for SLAs:
#GOAL_SUCCESS_PERCENTAGE (for the last 7 days) = SUCCESSFUL / TOTAL

#SUCCESSFUL (for the last 7 days) = issues having an SLA that is completed (SLA not running any more) AND successful (SLA is not breached) in the last 7 days

#TOTAL (for the last 7 days) = issues having an SLA that is breached (regardless of the SLA being still running or not) OR completed (SLA is not running any more) in the last 7 days
--------------------------------------------
#OVERALL_SUCCESS_PERCENTAGE = (SUCCESSFUL_GOAL_1 + SUCCESSFUL_GOAL_2 + ...) / (TOTAL_GOAL_1 + TOTAL_GOAL_2 + ...)
例:
Below is an example of 3 issues where the Time to first response SLA is completed and not breach over a total of 5 issues (3 issues where SLA is running and another 2 issues that still ongoing)
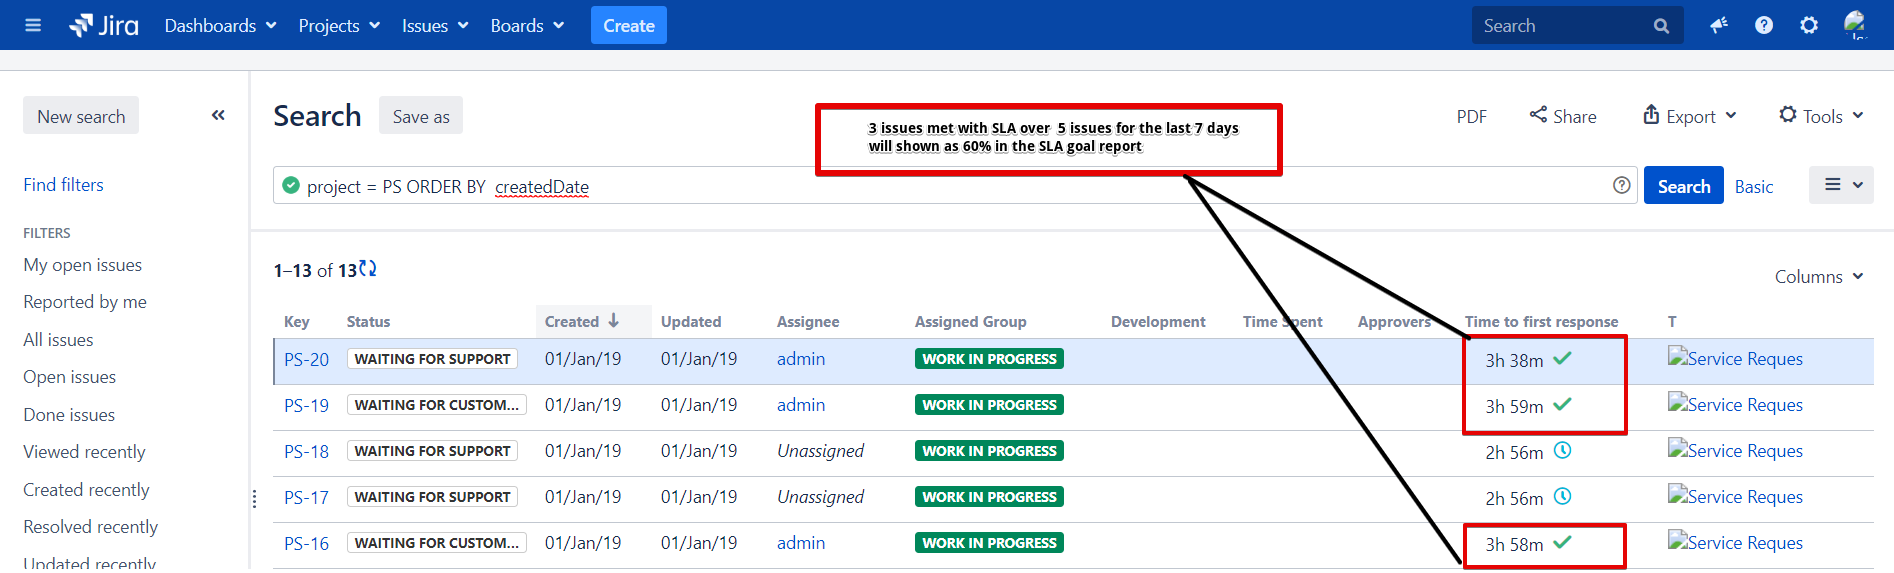

The calculation would be as below:
#GOAL_SUCCESS_PERCENTAGE (for the last 7 days) = 3 / 5 which is 60%

#SUCCESSFUL (for the last 7 days) = 3 (SLA completed and not breached)

#TOTAL (for the last 7 days) = 2 (Ongoing SLA that is not breached) + 3 (SLA completed) + 0 (Ongoing SLA that is breached) = 5
--------------------------------------------
#OVERALL_SUCCESS_PERCENTAGE = (3 + 0) / (5 + 0) = 3 / 5 which also return 60%, Overall percentage is added by 0 since there is no issue existed on the first goal.
Please take note on the SLA goals the total will include all of the issues where the SLA is still running/ongoing whether it is breached or not.
SLA success rate report
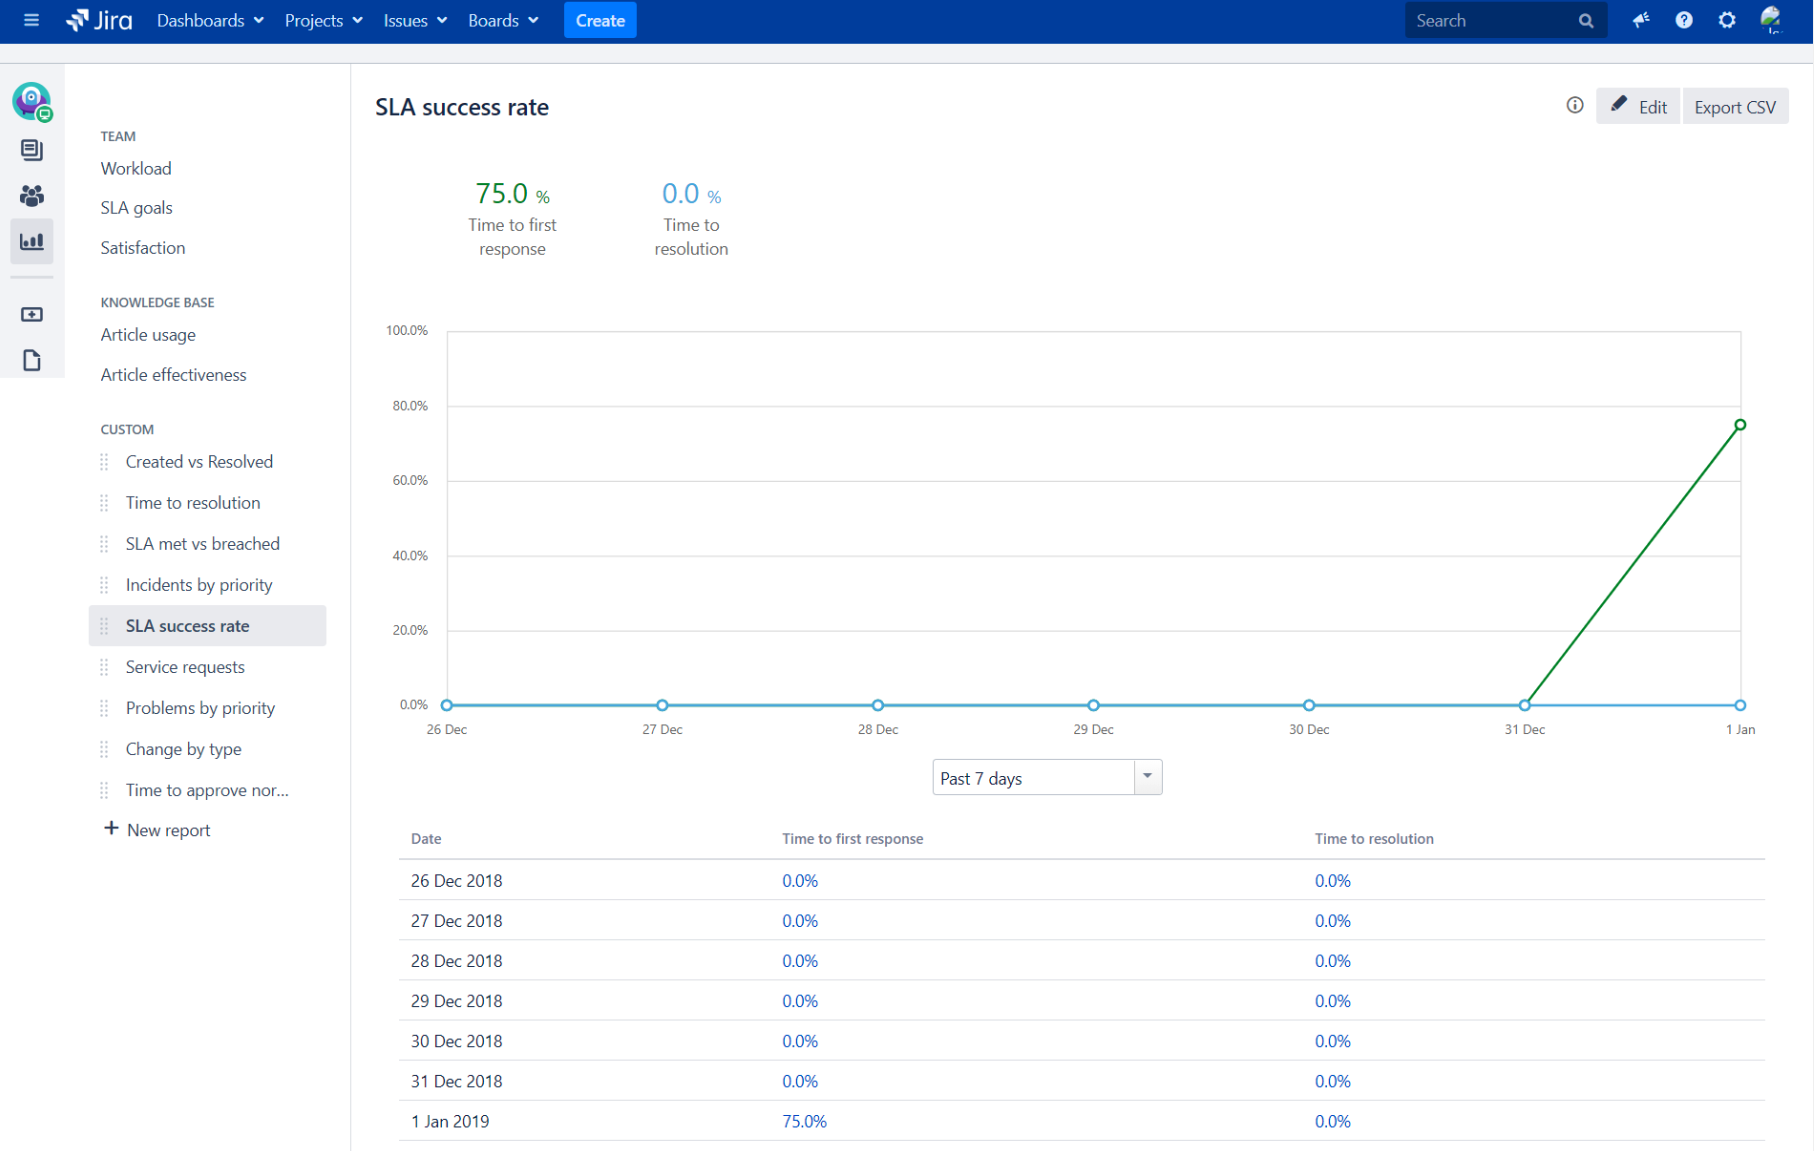
How SLA success rate report calculated given that it is shown as last 7 days format as above:
#GOAL_SUCCESS_PERCENTAGE (per day) = SUCCESSFUL (per day)/ TOTAL (per day)

#SUCCESSFUL (per day) = issues having an SLA that is completed (SLA not running any more) AND successful (SLA is not breached) per day

#TOTAL (per day) = issues having an SLA that is breached (SLA not running any more) + issues having SLA that is met (SLA is not running any more) per day
--------------------------------------------
#OVERALL_SUCCESS_RATE_PERCENTAGE = (SUCCESSFUL_GOAL_DAY_1 + SUCCESSFUL_GOAL_DAY_2 + ...) / (TOTAL_GOAL_DAY_1 + TOTAL_GOAL_DAY_2 + ...)
例:
The same set of example as above where 3 issues met their Time to first response SLA on 1st January, 1 issue breached on the same day.
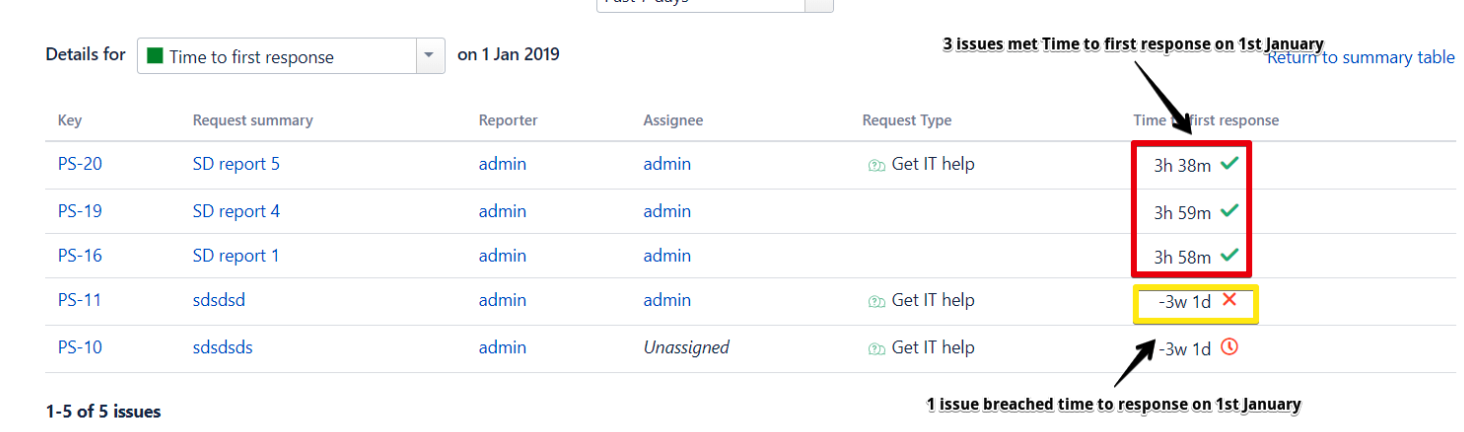
The percentage of success rate in 1st January will be 75% and for overall success rate will also be at 75% as the other days are empty.

The calculation would be as below:
#GOAL_SUCCESS_PERCENTAGE (per day) = 3 (per day)/ 4 (per day) = 3/4 = 75%

#SUCCESSFUL (per day) = 3 issues met SLA and SLA is STOP.

#TOTAL (per day) = 1 issue breached AND SLA is STOPPED + 3 issues met SLA AND SLA is STOPPED.
--------------------------------------------
#OVERALL_SUCCESS_RATE_PERCENTAGE = (3 + 0 + ...) / (4 + 0 + ...) = 3/4 = 75%
SLA success rate report will not include SLA that is still ongoing and only calculate the issues where the SLA is already stopped.