High memory usage or excessive number of open connections left after upgrade to Jira 8.x connected to Oracle database
プラットフォームについて: Server および Data Center のみ。この記事は、Server および Data Center プラットフォームのアトラシアン製品にのみ適用されます。
Support for Server* products ended on February 15th 2024. If you are running a Server product, you can visit the Atlassian Server end of support announcement to review your migration options.
*Fisheye および Crucible は除く
問題
Excessive memory usage occurring even after significantly increasing heap, specifically occurring after upgrade to Jira 8.x. In certain scenarios, it is also possible to note that thousands of connections are left in the CLOSE_WAIT status and blocked threads executing java.lang.ref.Finalizer calls, despite the memory usage.
診断
環境
This is specific to Jira instances connected to an Oracle Database using the 12.1.0.1 JDBC driver.
Diagnostic Steps
You can run the following command to diagnose an excessive number of connections left on CLOSE_WAIT status:
netstat -al | grep CLOSE_WAITUpon generating a set of thread dumps we can see blocked threads related to the Oracle JDBC driver:
priority:8 - threadId:0x0000000000000003 - nativeId:0 - nativeId (decimal):0 - state:BLOCKED
stackTrace:
java.lang.Thread.State: BLOCKED (on object monitor)
at oracle.jdbc.driver.OracleStatement.close(OracleStatement.java:1334)
- waiting to lock <0x000000003d51fbe6> (a oracle.jdbc.driver.T4CConnection)
owned by Jira-INFORM-Thread-0 id=0x0000000000000128
at oracle.jdbc.driver.OracleStatementWrapper.close(OracleStatementWrapper.java:100)
at oracle.jdbc.driver.OraclePreparedStatementWrapper.close(OraclePreparedStatementWrapper.java:82)
at org.apache.commons.dbcp2.DelegatingStatement.close(DelegatingStatement.java:156)
at org.apache.commons.dbcp2.DelegatingStatement.close(DelegatingStatement.java:156)
at org.apache.commons.dbcp2.DelegatingStatement.finalize(DelegatingStatement.java:550)
at java.lang.System$2.invokeFinalize(System.java:1273)
at java.lang.ref.Finalizer.runFinalizer(Finalizer.java:102)
at java.lang.ref.Finalizer.access$100(Finalizer.java:34)
at java.lang.ref.Finalizer$FinalizerThread.run(Finalizer.java:217)
If you're seeing high memory usage in the logs, you can use the method described in Analyze OutofMemory errors in Jira server with Heap Dumps to generate a heap dump for further analysis. On the heap dump analysis it is possible to observe that
java.lang.ref.Finalizerclasses of objects are using an exorbitant amount of heap space: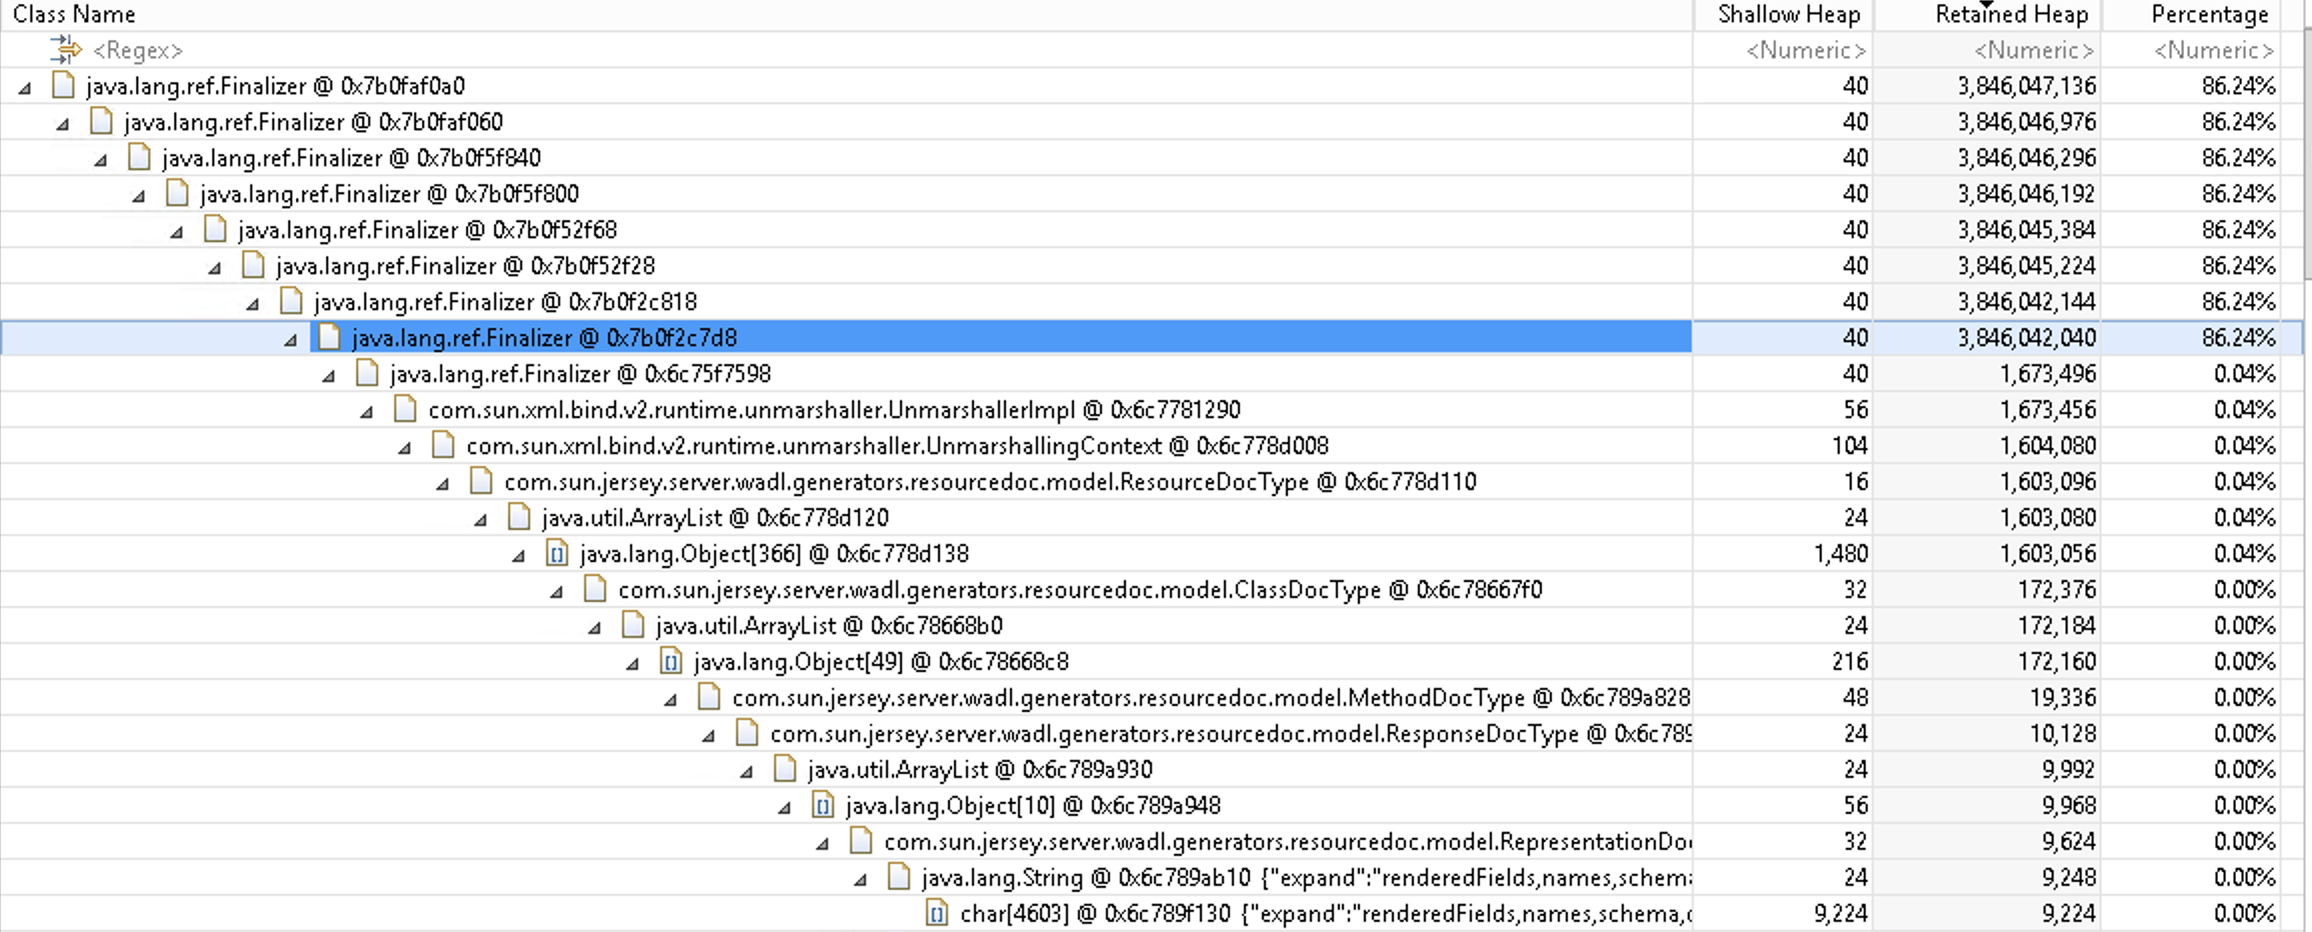
原因
The root cause of this is still being investigated, however, the symptom has been associated with the use of the 12.1.0.1 Oracle database drivers.
回避策
Update the Oracle JDBC driver from 12.1.0.1 to the latest compatible as per our Jira Supported Platforms:
- Jira を停止します。
- Download the driver from the link on the supported platforms article.
- Place the newly downloaded driver into $Jira_INSTALL/lib directory.
- Remove the existing driver with the version 12.1.0.1.
- Restart your Jira and check if the issue persists.
![]() Some users have reported running into problems by updating to the 12.2.x.x driver versions (e.g. JRASERVER-68476 - Getting issue details... STATUS ).
Some users have reported running into problems by updating to the 12.2.x.x driver versions (e.g. JRASERVER-68476 - Getting issue details... STATUS ).