Database latency impact on Jira performance
プラットフォームについて: Server および Data Center のみ。この記事は、Server および Data Center プラットフォームのアトラシアン製品にのみ適用されます。
Support for Server* products ended on February 15th 2024. If you are running a Server product, you can visit the Atlassian Server end of support announcement to review your migration options.
*Fisheye および Crucible は除く
Database latency is the time it takes to send, execute and receive a response for a minimal database query.
The latency usually consists of the following components:
database server latency itself
network latency for a network path between the application and the database server (including network routers and switches)
latency of proxies, load balancers or other components in the path (e.g. highly-available database solutions)
Naturally, the database latency does affect Jira – high latency would drop the performance.
The actual latency effect depends on dataset characteristics, usage patterns, hardware, etc. Still, we executed a number of performance tests against Jira 8.13.8 (with MySQL 5.7.32) to measure the latency impact at our test environments. The following graphs present the results.
To introduce the network delays, we used Toxiproxy and we used JDBC Tester to validate the delays are accurate. To measure the actions, we used Jira Performance Tests (JPT).
![]() We have observed in support cases that latency might have a significantly higher impact in reindexing time than it does in normal operations seen below. A 2ms latency average could have the reindexing job take as much as 4 times longer than sub 0.5ms.
We have observed in support cases that latency might have a significantly higher impact in reindexing time than it does in normal operations seen below. A 2ms latency average could have the reindexing job take as much as 4 times longer than sub 0.5ms.
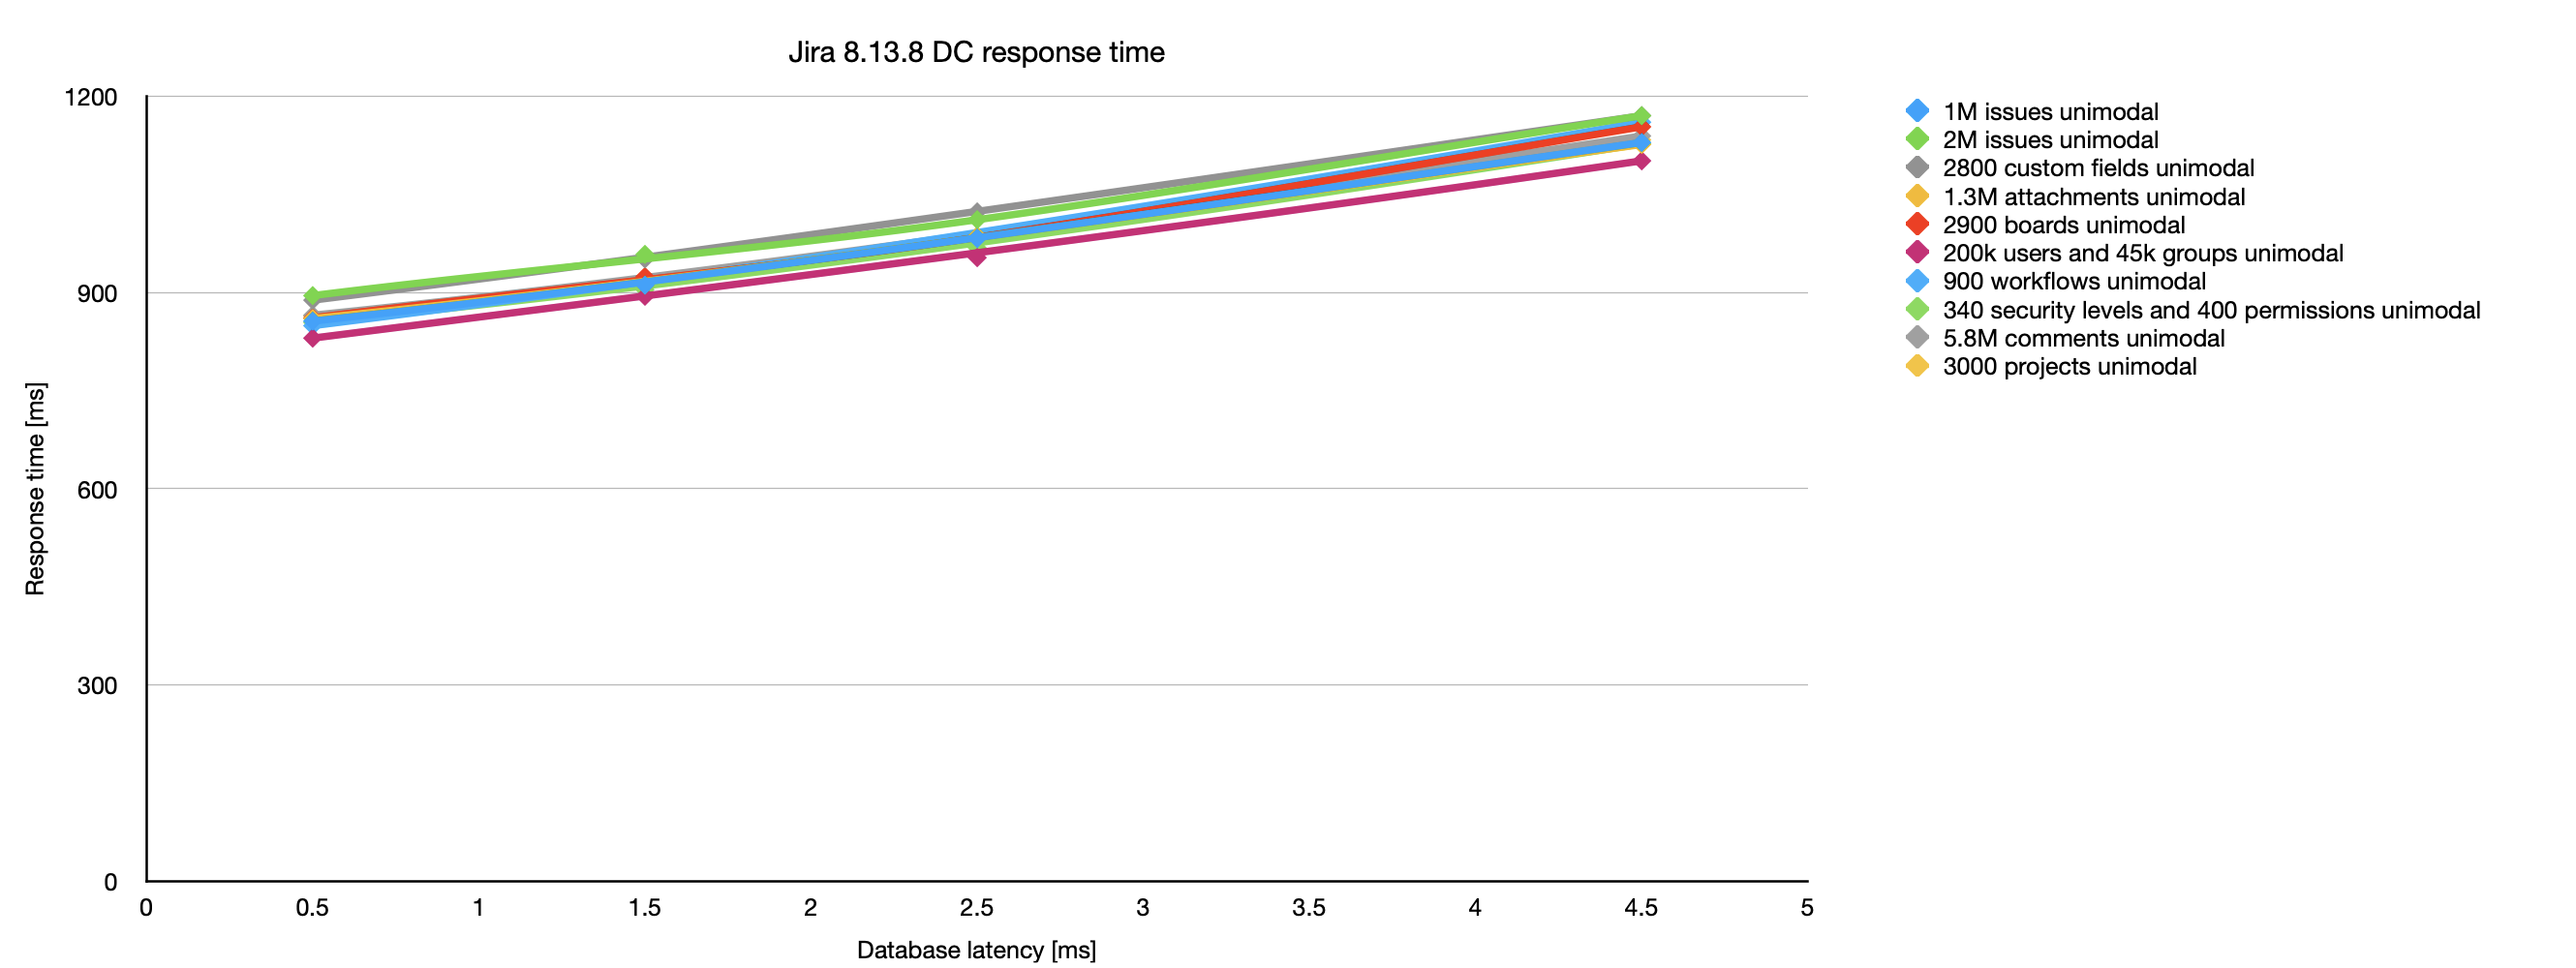
Per dataset (mixed actions)
Absolute response time
Relative slowdown
(latency effect comparing to a reference data point at 0.5 ms latency)

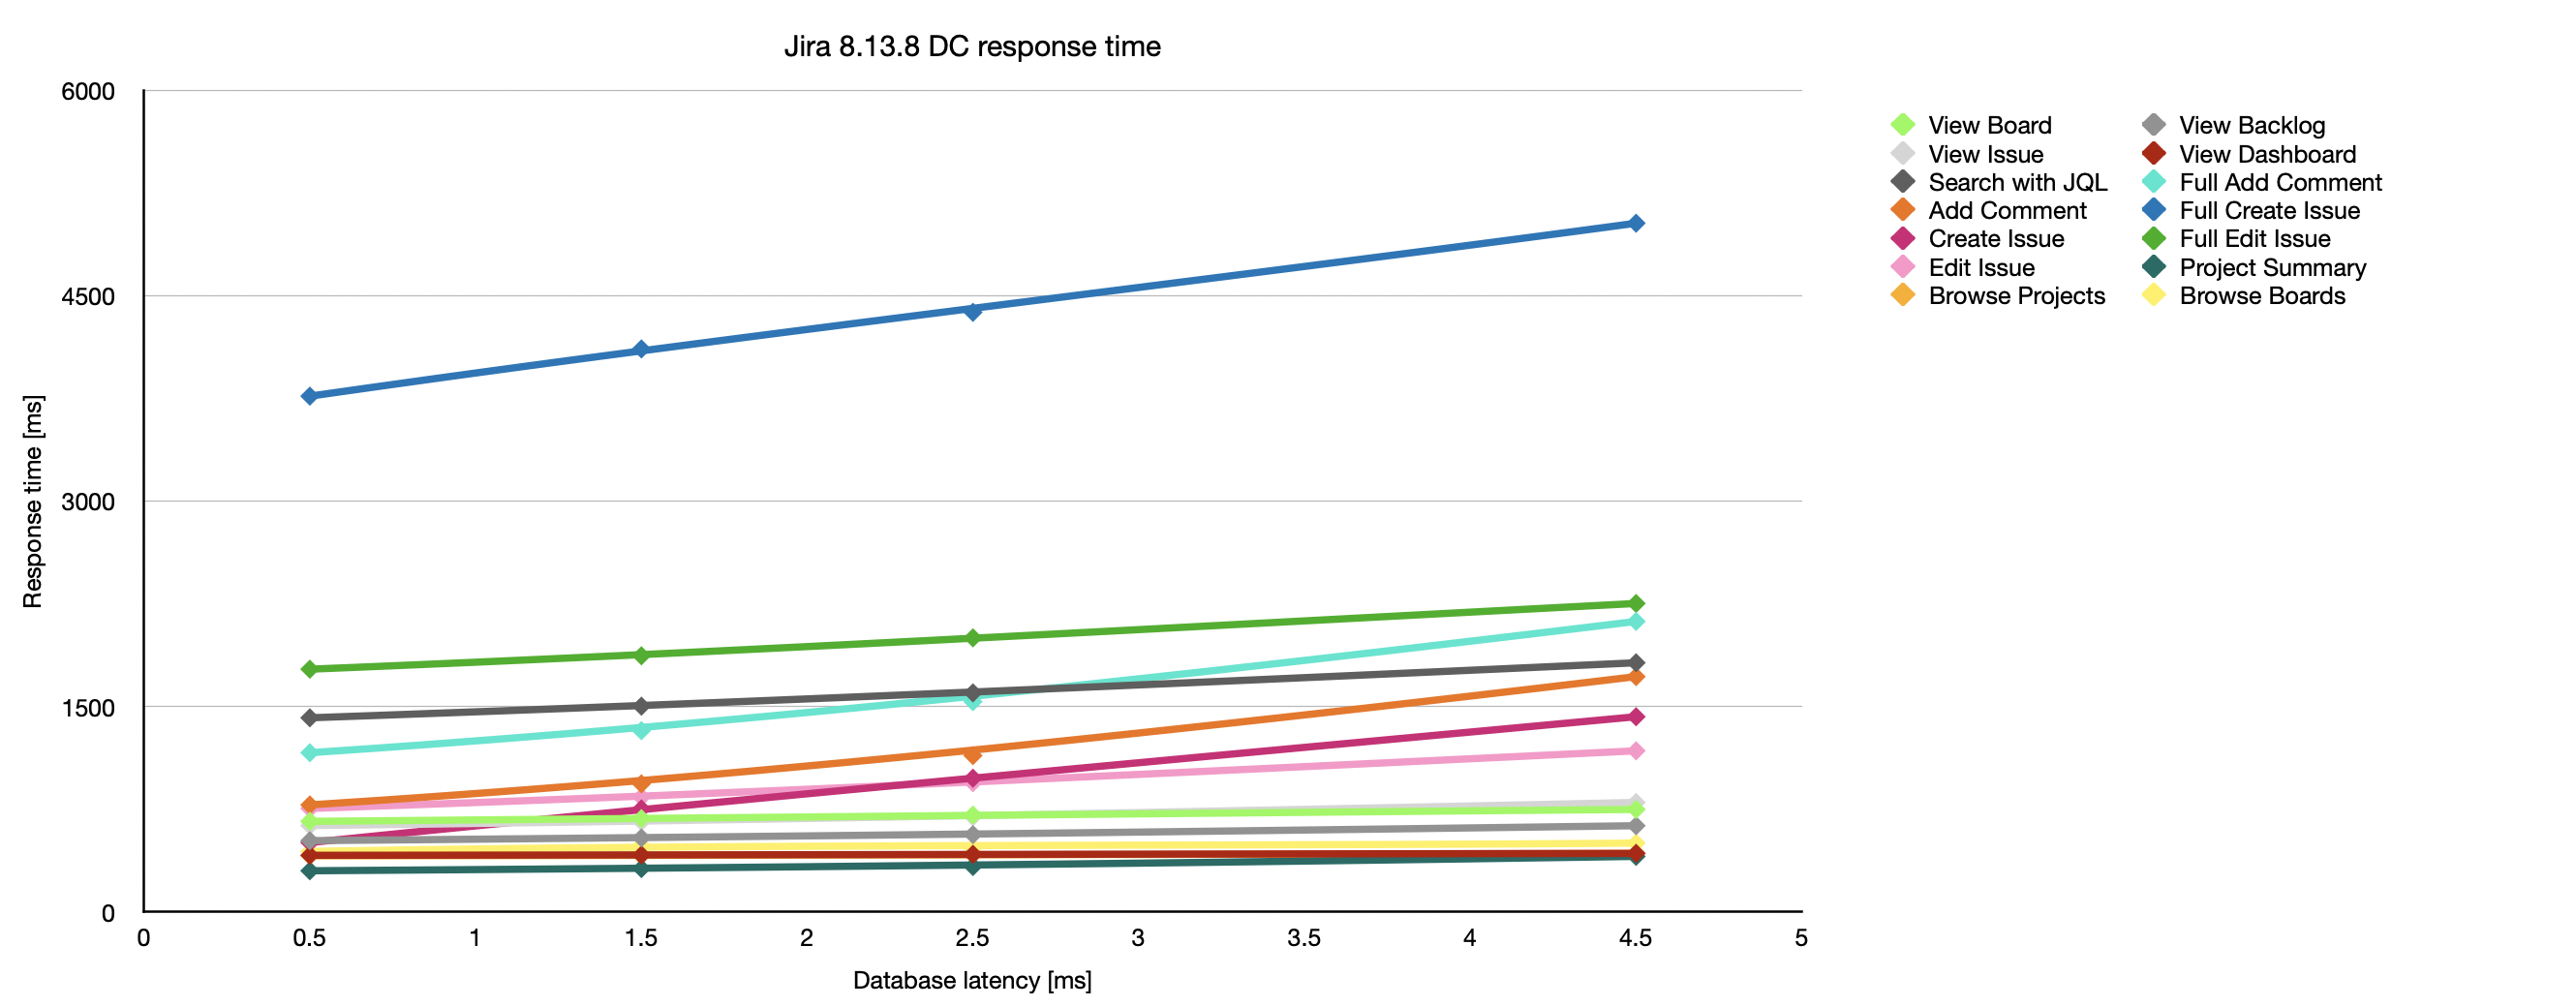
Per action (mixed datasets)
Absolute response time
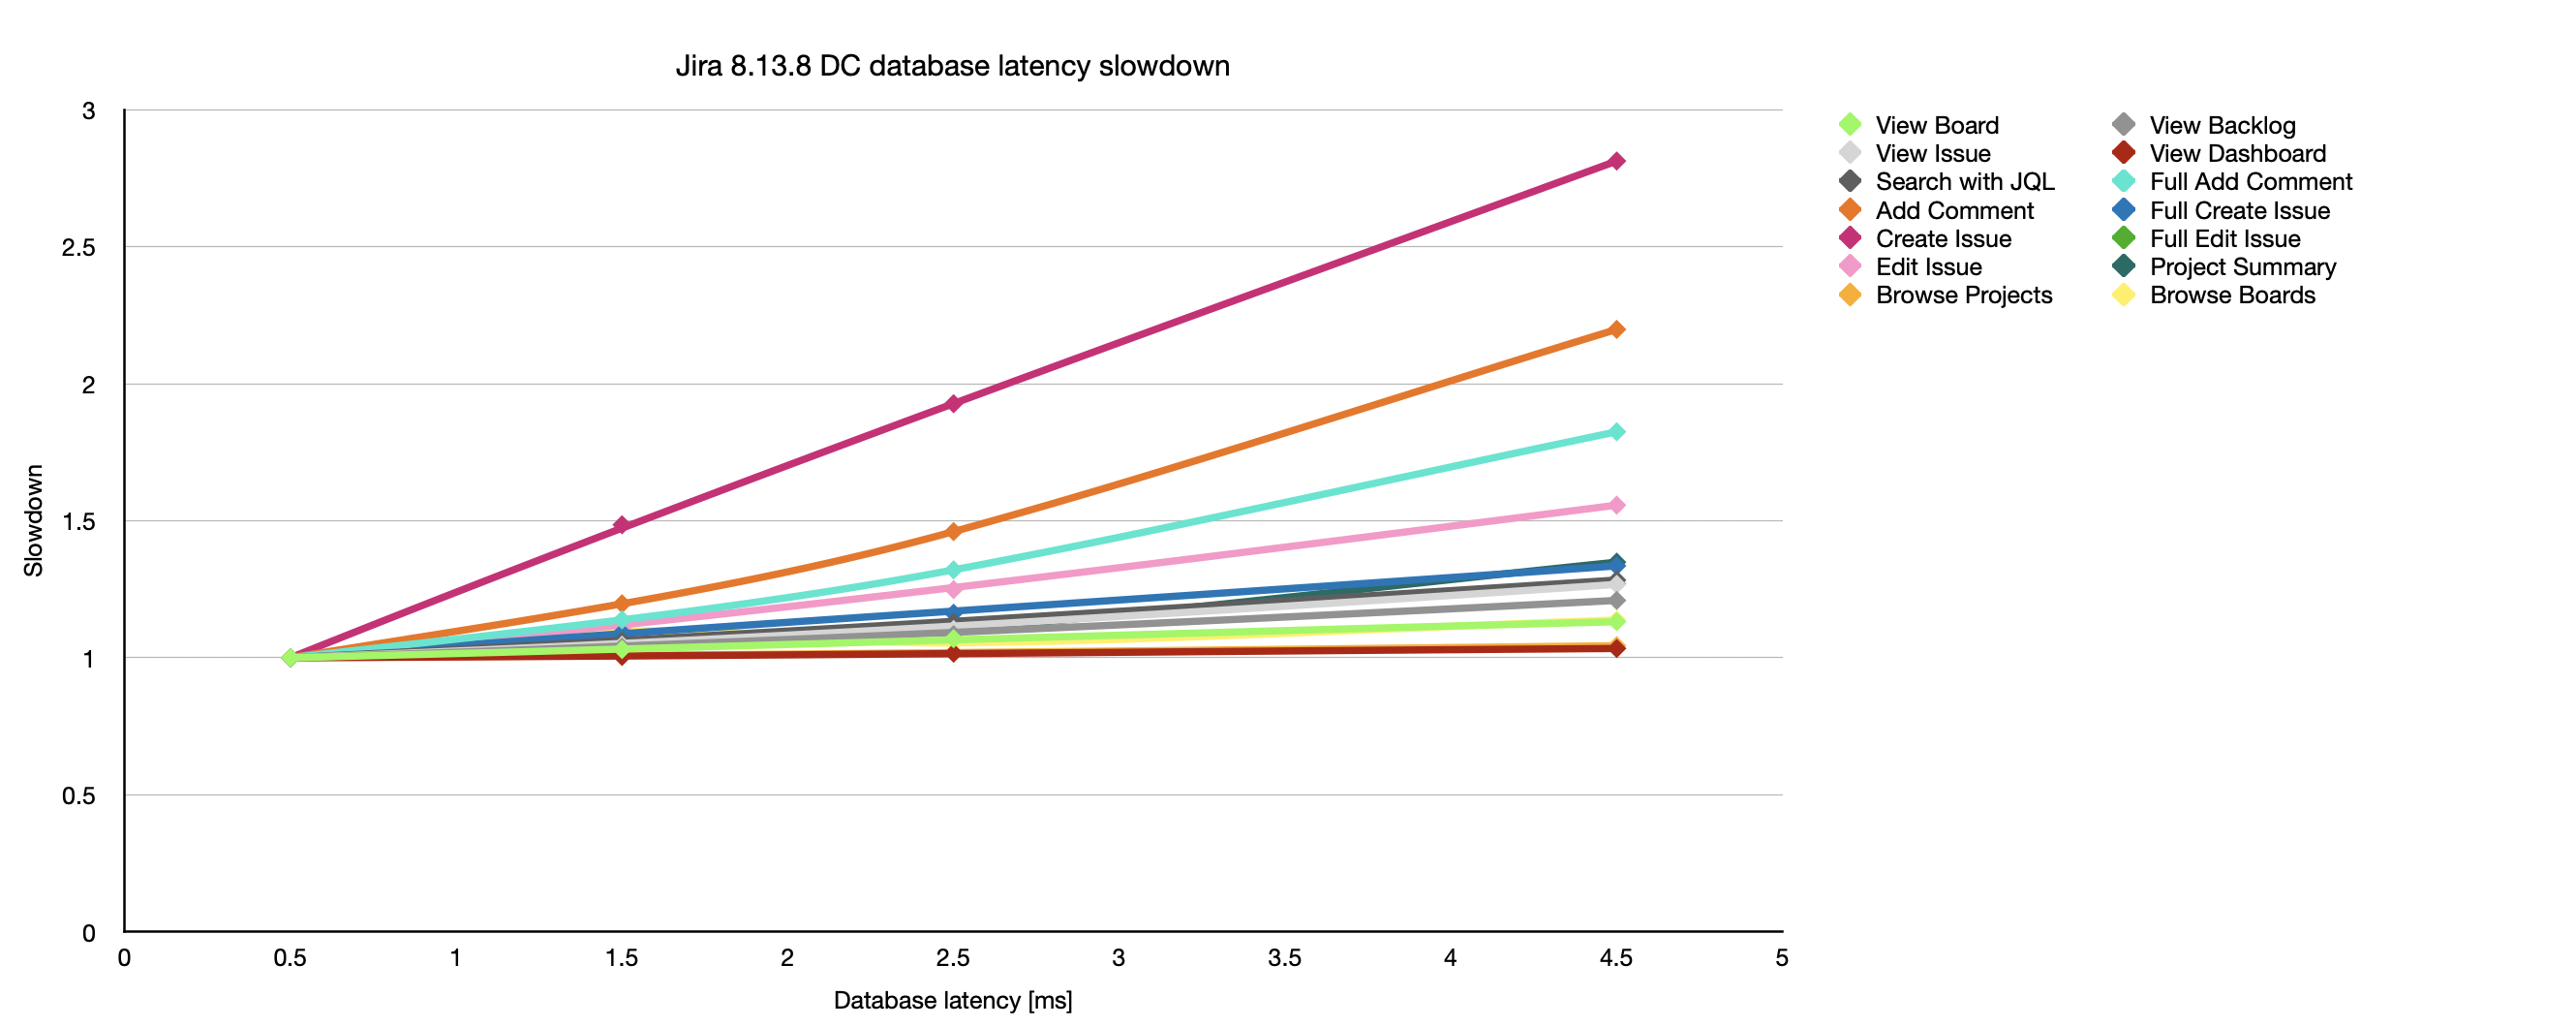
Relative slowdown
(latency effect comparing to a reference data point at 0.5 ms latency)
Measurement data
Dataset | Average response time [ms] | Slowdown [%], compared to 0.5 ms latency | |||||
|---|---|---|---|---|---|---|---|
0.5 ms latency | 1.5 ms latency | 2.5 ms latency | 4.5 ms latency | 1.5 ms latency | 2.5 ms latency | 4.5 ms latency | |
1M issues unimodal | 856 | 911 | 983 | 1129 | 6.67 | 14.17 | 32.67 |
2M issues unimodal | 895 | 958 | 1011 | 1170 | 7.4 | 12.33 | 30.73 |
2800 custom fields unimodal | 888 | 951 | 1023 | 1170 | 7.34 | 14.56 | 31.17 |
1.3M attachments unimodal | 860 | 911 | 986 | 1126 | 6.05 | 14.25 | 32.47 |
2900 boards unimodal | 861 | 924 | 984 | 1153 | 6.7 | 15.49 | 34.54 |
200k users and 45k groups unimodal | 830 | 894 | 953 | 1101 | 7.71 | 14.68 | 32.33 |
900 workflows unimodal | 849 | 912 | 982 | 1160 | 7.29 | 15.8 | 36.15 |
340 security levels and 400 permissions unimodal | 854 | 904 | 968 | 1127 | 5.98 | 13.08 | 33.22 |
5.8M comments unimodal | 865 | 917 | 986 | 1139 | 5.65 | 14.65 | 32.75 |
3000 projects unimodal | 864 | 911 | 976 | 1133 | 4.95 | 13.89 | 32.36 |
操作 | Average response time [ms] | Slowdown [%], compared to 0.5 ms latency | |||||
|---|---|---|---|---|---|---|---|
0.5 ms latency | 1.5 ms latency | 2.5 ms latency | 4.5 ms latency | 1.5 ms latency | 2.5 ms latency | 4.5 ms latency | |
ボードの表示 | 662 | 682 | 708 | 749 | 3.02 | 6.95 | 13.14 |
バックログを表示 | 521 | 541 | 565 | 630 | 3.84 | 8.45 | 20.92 |
課題の表示 | 631 | 660 | 696 | 800 | 4.6 | 10.3 | 26.78 |
ダッシュボードの表示 | 414 | 416 | 421 | 428 | 0.48 | 1.69 | 3.38 |
JQL の検索 | 1418 | 1503 | 1600 | 1820 | 5.99 | 12.83 | 28.35 |
Full Add Comment | 1163 | 1324 | 1536 | 2122 | 13.84 | 32.07 | 82.46 |
コメントを追加 | 782 | 936 | 1142 | 1719 | 19.69 | 46.04 | 119.82 |
Full Create Issue | 3767 | 4112 | 4379 | 5030 | 9.16 | 16.25 | 33.53 |
課題の作成 | 507 | 753 | 977 | 1426 | 48.52 | 92.7 | 181.26 |
Full Edit Issue | 1773 | 1871 | 2002 | 2253 | 5.53 | 12.92 | 27.07 |
課題の編集 | 756 | 839 | 944 | 1177 | 10.98 | 24.87 | 55.69 |
プロジェクトの要約 | 301 | 317 | 332 | 406 | 5.32 | 10.3 | 34.88 |
プロジェクトの参照 | 410 | 413 | 417 | 428 | 0.73 | 1.71 | 4.39 |
ボードの参照 | 442 | 485 | 466 | 503 | 9.73 | 5.43 | 13.8 |